뉴스브리핑센터
한의약융합데이터 콘텐츠 바로가기
동향분석
Home > 뉴스브리핑센터 > 동향분석


| NATURE에 실린 코로나19 (COVID-19) 아티클 소개 (~3/18) |
|
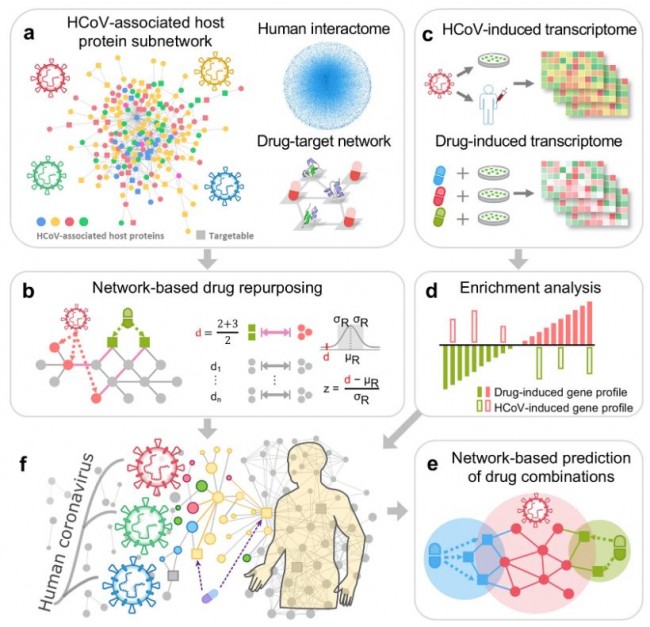
News | 17 March 2020 코로나바이러스 최신 뉴스: 미국에서 코로나19 백신 임상시험 첫 시작 수만 명의 사람을 감염시키고 수천 명을 사망에 이르게 한 호흡기 질환에 대한 업데이트 Coronavirus latest: First vaccine clinical trials begin in United States Updates on the respiratory illness that has infected tens of thousands of people and killed several thousand. https://www.nature.com/articles/d41586-020-00154-w News | 17 March 2020 중국의 코로나바이러스에 대한 대응이 다른 국가에 미치는 영향은? 연구자들은 바이러스성 전염병의 통제를 위한 해답을 찾기 위해 중국의 봉쇄 정책을 연구 중 What China’s coronavirus response can teach the rest of the world Researchers are studying the effects of China's lockdowns to glean insights about controlling the viral pandemic. https://www.nature.com/articles/d41586-020-00741-x Editorial | 17 March 2020 코로나바이러스: 모든 정부와 과학 전문가들이 지금 꼭 해야 할 3가지 세계보건기구(WHO)의 조언을 따르고, 의사결정 시 공유하며, 전 세계적으로 협력하기 Coronavirus: three things all governments and their science advisers must do now Follow World Health Organization advice, end secrecy in decision-making and cooperate globally. https://www.nature.com/articles/d41586-020-00772-4 Correspondence | 17 March 2020 COVID-19: 청각 장애인을 잊지 마세요. COVID-19: don’t forget deaf people https://www.nature.com/articles/d41586-020-00782-2 Research | 16 March 2020 신종 코로나바이러스 2019-nCoV/SARS-CoV-2를 위해 네트워크 기반 약물이 ‘치료 목적’으로 쓰이다. Network-based drug repurposing for novel coronavirus 2019-nCoV/SARS-CoV-2 https://www.nature.com/articles/s41421-020-0153-3 Fig. 1: Overall workflow of this study
Our network-based methodology combines a systems pharmacology-based network medicine platform that quantifies the interplay between the virus–host interactome and drug targets in the human PPI network. a Human coronavirus (HCoV)-associated host proteins were collected from literatures and pooled to generate a pan-HCoV protein subnetwork. b Network proximity between drug targets and HCoV-associated proteins was calculated to screen for candidate repurposable drugs for HCoVs under the human protein interactome model. c, d Gene set enrichment analysis was utilized to validate the network-based prediction. e Top candidates were further prioritized for drug combinations using network-based method captured by the “Complementary Exposure” pattern: the targets of the drugs both hit the HCoV–host subnetwork, but target separate neighborhoods in the human interactome network. f Overall hypothesis of the network-based methodology: (i) the proteins that functionally associate with HCoVs are localized in the corresponding subnetwork within the comprehensive human interactome network; and (ii) proteins that serve as drug targets for a specific disease may also be suitable drug targets for potential antiviral infection owing to common protein–protein interactions elucidated by the human interactome. Fig. 2: Phylogenetic analysis of coronaviruses
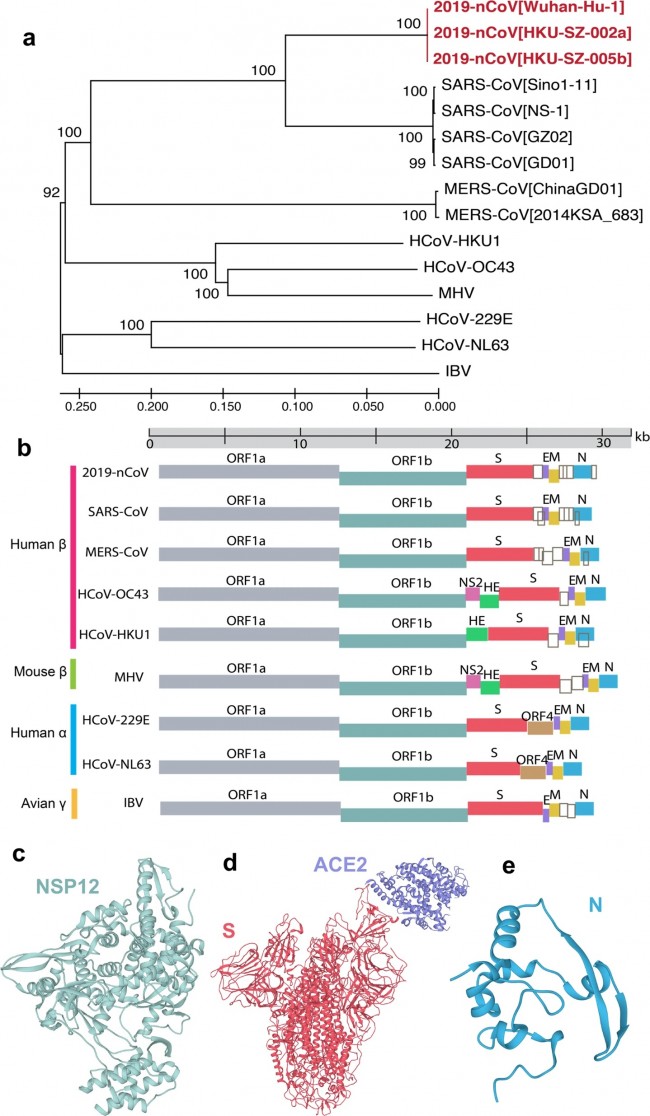
a Phylogenetic tree of coronavirus (CoV). Phylogenetic algorithm analyzed evolutionary conservation among whole genomes of 15 coronaviruses. Red color highlights the recent emergent coronavirus, 2019-nCoV/SARS-CoV-2. Numbers on the branches indicate bootstrap support values. The scale shows the evolutionary distance computed using the p-distance method. b Schematic plot for HCoV genomes. The genus and host information of viruses was labeled on the left by different colors. Empty dark gray boxes represent accessory open reading frames (ORFs). c–e The 3D structures of SARS-CoV nsp12 (PDB ID: 6NUR) (c), spike (PDB ID: 6ACK) (d), and nucleocapsid (PDB ID: 2CJR) (e) shown were based on homology modeling. Genome information and phylogenetic analysis results are provided in Supplementary Tables S1 and S2. Fig. 3: Drug-target network analysis of the HCoV–host interactome
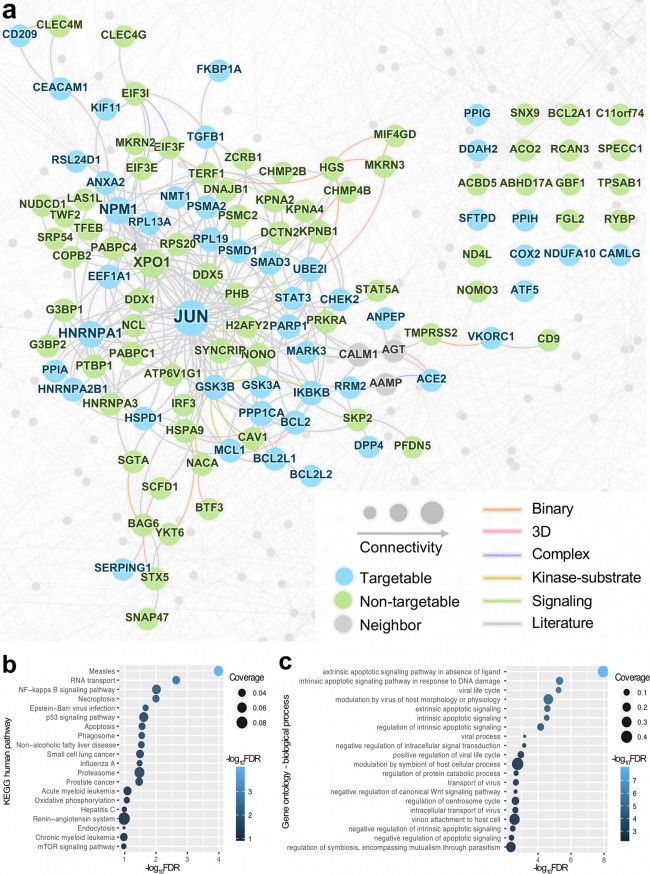
a A subnetwork highlighting the HCoV–host interactome. Nodes represent three types of HCoV-associated host proteins: targetgable (proteins can be targeted by approved drugs or drugs under clinical trials), non-targetable (proteins do not have any known ligands), neighbors (protein–protein interaction partners). Edge colors indicate five types of experimental evidence of the protein–protein interactions (see Materials and methods). 3D three-dimensional structure. b, c KEGG human pathway (b) and gene ontology enrichment analyses (c) for the HCoV-associated proteins. Fig. 4: A discovered drug-HCoV network
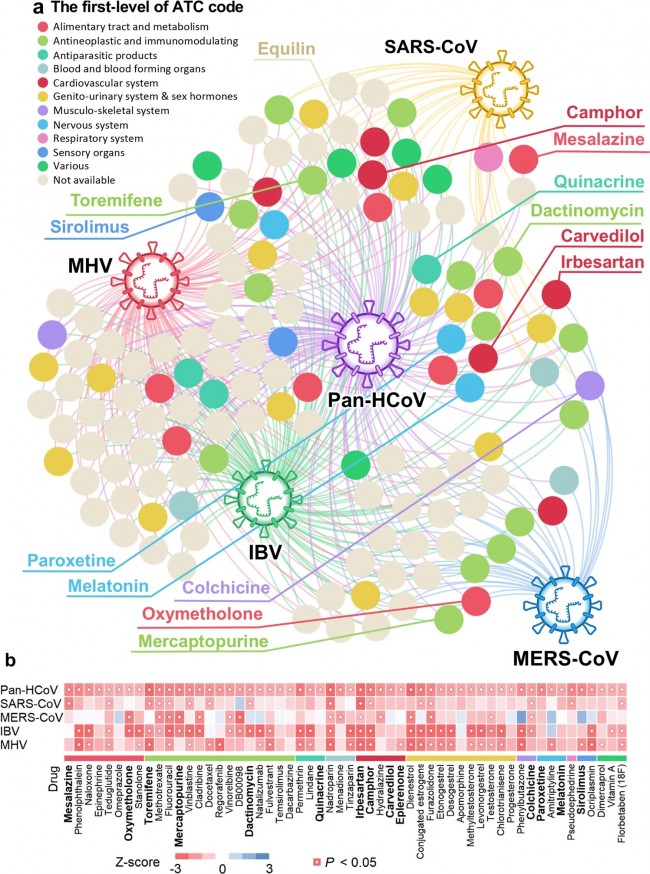
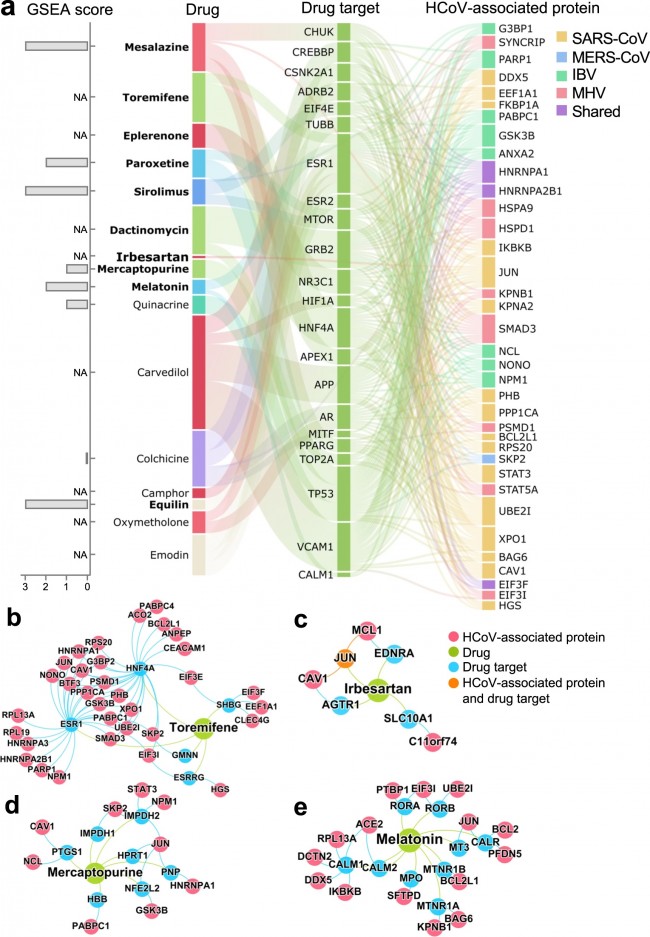
a A subnetwork highlightingnetwork-predicted drug-HCoV associations connecting 135 drugs and HCoVs. Fromthe 2938 drugs evaluated, 135 ones achieved significant proximities betweendrug targets and the HCoV-associated proteins in the human interactome network.Drugs are colored by their first-level of the Anatomical Therapeutic Chemical(ATC) classification system code. b A heatmap highlighting network proximityvalues for SARS-CoV, MERS-CoV, IBV, and MHV, respectively. Color key denotesnetwork proximity (Z-score) between drug targets and the HCoV-associatedproteins in the human interactome network. P value was computed by permutationtest. Fig. 5: A discovered drug-protein-HCoV network for 16 candidate repurposable drugs
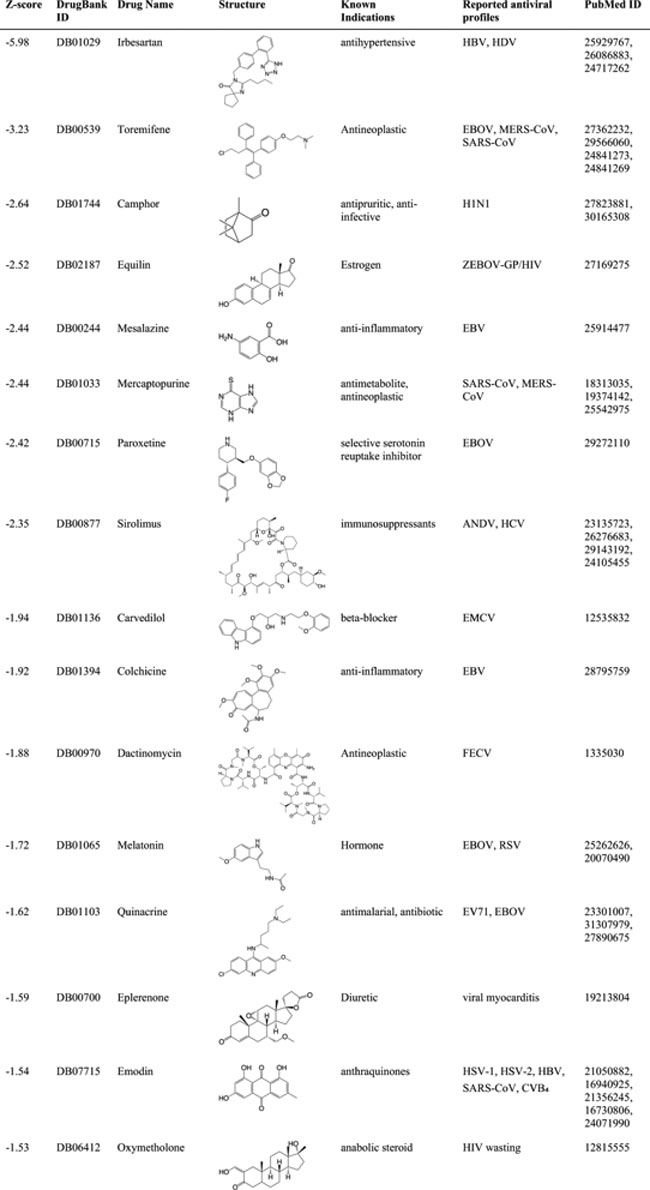
a Network-predicted evidence and gene setenrichment analysis (GSEA) scores for 16 potential repurposable drugs forHCoVs. The overall connectivity of the top drug candidates to theHCoV-associated proteins was examined. Most of these drugs indirectly targetHCoV-associated proteins via the human protein–protein interaction networks.All the drug–target-HCoV-associated protein connections were examined, andthose proteins with at least five connections are shown. The box heights forthe proteins indicate the number of connections. GSEA scores for eight drugswere not available (NA) due to the lack of transcriptome profiles for thedrugs. b–e Inferred mechanism-of-action networks for four selected drugs: b toremifene (first-generation nonsteroidal-selective estrogen receptormodulator), c irbesartan (an angiotensin receptor blocker), d mercaptopurine(an antimetabolite antineoplastic agent with immunosuppressant properties), and e melatonin (a biogenic amine for treating circadian rhythm sleep disorders). Table 1 Top 16 network-predictedrepurposable drugs with literature-derived antiviral evidence.
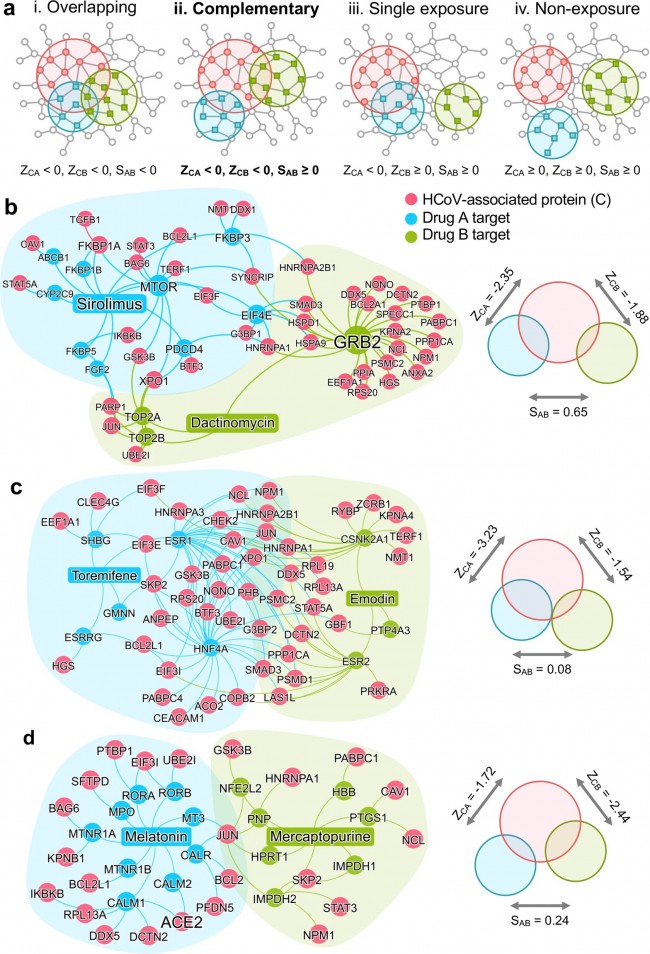
HBV hepatitis B virus, HCV hepatitis C virus, HDV hepatitis delta virus, EBOV Ebola viruses, ZEBOV-GP Zaire Ebola virus glycoprotein, HIV human immunodeficiency virus, EBV Epstein-Barr virus, ANDV Andes orthohantavirus, EMCV encephalomyocarditis virus, FECV feline enteric coronavirus, RSV respiratory syncytial virus, EV71 enterovirus 71, HSV-1 and -2 herpes simplex viruses, CVB4 Coxsackievirus B4. Fig. 6: Network-based rational design of drug combinations for 2019-nCoV/SARS-CoV-2.
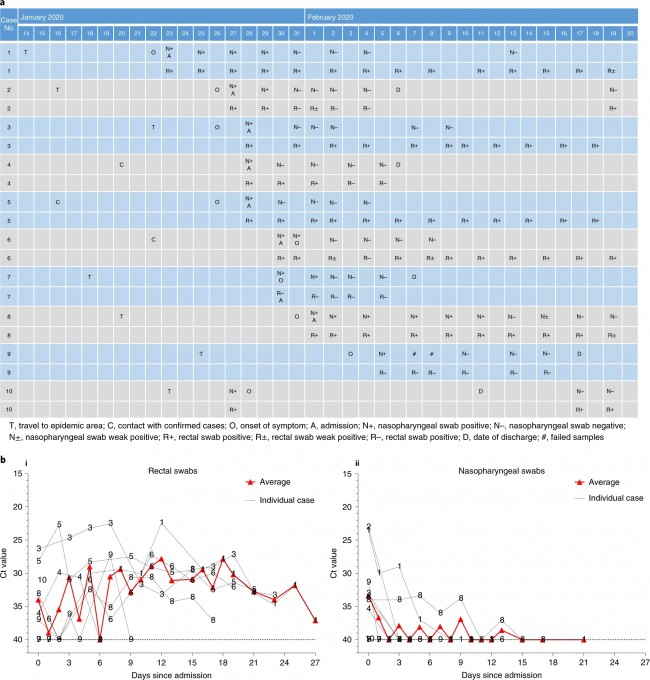
a The possible exposure mode of theHCoV-associated protein module to the pairwise drug combinations. An effectivedrug combination will be captured by the “Complementary Exposure” pattern: thetargets of the drugs both hit the HCoV–host subnetwork, but target separateneighborhoods in the human interactome network. ZCA and ZCB denote the networkproximity (Z-score) between targets (Drugs A and B) and a specific HCoV. SABdenotes separation score (see Materials and methods) of targets between Drug Aand Drug B. b–d Inferred mechanism-of-action networks for three selectedpairwise drug combinations: b sirolimus (a potent immunosuppressant with bothantifungal and antineoplastic properties) plus dactinomycin (an RNA synthesisinhibitor for treatment of various tumors), c toremifene (first-generationnonsteroidal-selective estrogen receptor modulator) plus emodin (anexperimental drug for the treatment of polycystic kidney), and d melatonin (abiogenic amine for treating circadian rhythm sleep disorders) plusmercaptopurine (an antimetabolite antineoplastic agent with immunosuppressantproperties). News | 16 March 2020 학회가 없는 해? 코로나바이러스 감염이 어떻게 연구를 바꾸었나. 세계적인 과학 학회가 취소됨에 따라 연구자들은 그들이 어떻게 네트워크를 형성해왔는지 다시 생각해보는 기회가 되었다. A year without conferences? How the coronavirus pandemic could change research As scientific meetings are cancelled worldwide, researchers are rethinking how they network — a move that some say is long overdue. https://www.nature.com/articles/d41586-020-00786-y Correspondence | 16 March 2020 환자 회복 전 수반되는 다양한 면역 반응: 심각하지 않은 COVID-19 사례 보고 Breadth of concomitant immune responses prior to patient recovery: a case report of non-severe COVID-19 https://www.nature.com/articles/s41591-020-0819-2 Fig. 1: Emergence of immune responses during non-severe symptomatic COVID-19 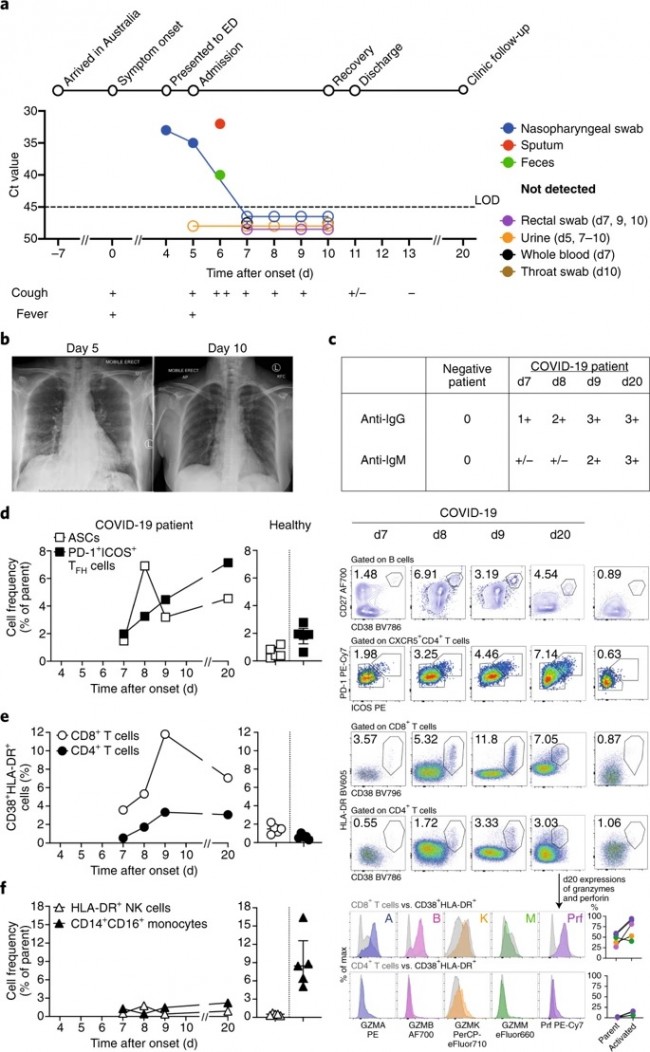 a, Timeline of COVID-19, showing detection of SARS-CoV-2 in sputum, nasopharyngeal aspirates and feces but not urine, rectal swab or whole blood. SARS-CoV-2 was quantified by rRT-PCR; cycle threshold (Ct) is shown. A higher Ct value means lower viral load. Dashed horizontal line indicates limit of detection (LOD) threshold (Ct = 45). Open circles, undetectable SARS-CoV-2. b, Anteroposterior chest radiographs on days 5 and 10 following symptom onset, showing radiological improvement from hospital admission to discharge. c, Immunofluorescence antibody staining, repeated twice in duplicate, for detection of IgG and IgM bound to SARS-CoV-2-infected Vero cells, assessed with plasma (diluted 1:20) obtained at days 7–9 and 20 following symptom onset. d–f, Frequency (left set of plots) of CD27hiCD38hi ASCs (gated on CD3–CD19+ lymphocytes) and activated ICOS+PD-1+ TFH cells (gated on CD4+CXCR5+ lymphocytes) (d), activated CD38+HLA-DR+ CD8+ or CD4+ T cells (e), and CD14+CD16+ monocytes and activated HLA-DR+ natural killer (NK) cells (gated on CD3–CD14–CD56+ cells) (f), detected by flow cytometry of blood collected at days 7–9 and 20 following symptom onset in the patient and in healthy donors (n = 5; median with interquartile range); gating examples at right. Bottom right histograms and line graphs, staining of granzyme A (GZMA (A)), granzyme B (GZMB (B)), granzyme K (GZMK (K)), granzyme M (GZMM (M)) and perforin (Prf) in parent CD8+ and CD4+ T cells and activated CD38+HLA-DR+ CD8+ and CD4+ T cells. Gating and experimental details are in Extended Data Fig. 3. News | 13 March 2020 코로나바이러스, 얼마나 눈에 띄지 않게 퍼졌나? 3명의 보건 당국 관계자는 지역 발병률의 규모 측정과 방지 전략이 헛되지 않은 이유에 대해 말했다. How much is coronavirus spreading under the radar? Three leading health officials talk about gauging the size of local outbreaks, and why containment strategies aren’t futile yet. Research | 13 March 2020 소아 SARS -CoV-2 감염의 특성 및 대변을 통한 지속적 바이러스 발생에 대한 잠재적 근거 Characteristics of pediatric SARS-CoV-2 infection and potential evidence for persistent fecal viral shedding Table 1 Epidemiological and clinical characteristics of n = 10 independent pediatric patients confirmed with SARS-CoV-2 infection 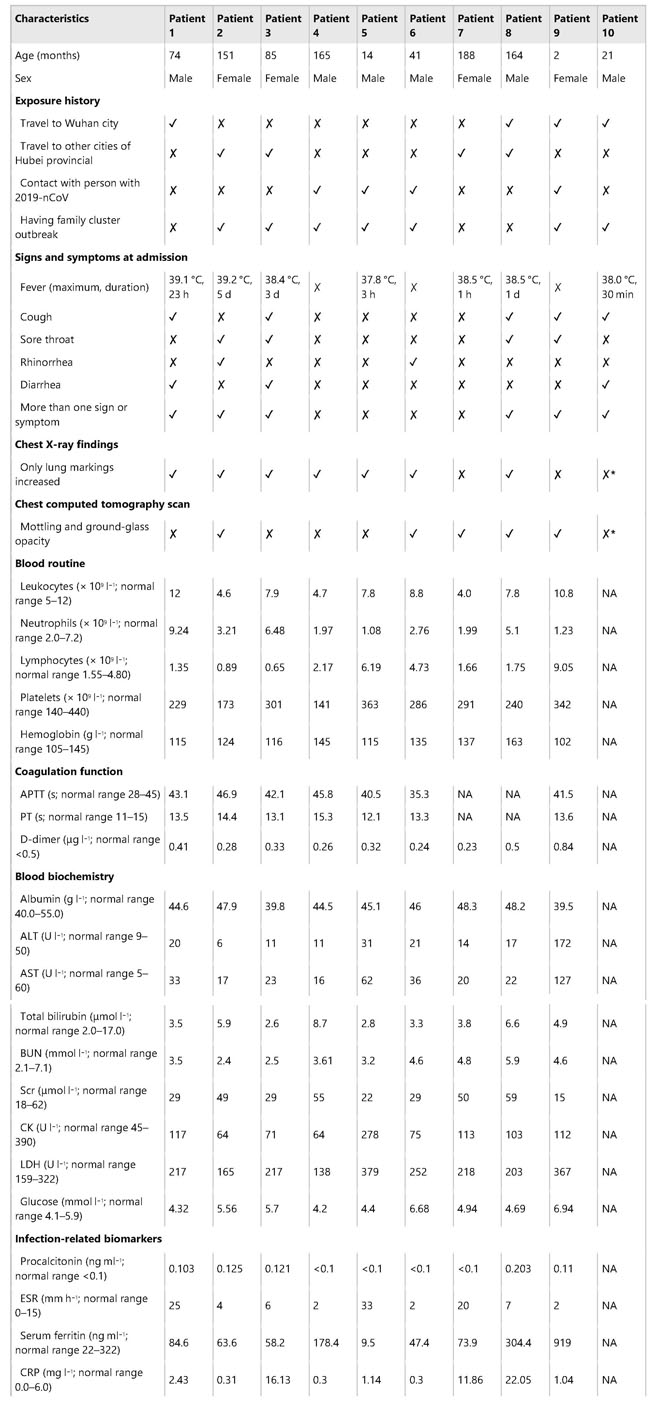 ✓,with; ✗,without; *, recovered phase; APTT, activated partial thromboplastin time; PT,prothrombin time; ALT, alanine aminotransferase; AST, aspartateaminotransferase; BUN, blood urea nitrogen; Scr, serum creatinine; CK, creatinekinase; LDH, lactate dehydrogenase; ESR, erythrocyte sedimentation rate; CRP,C-reactive protein; NA, not available. Fig. 1: Chronology of major epidemiological events and molecular testing results of n = 10 independent pediatric patients confirmed with SARS-CoV-2 infection.
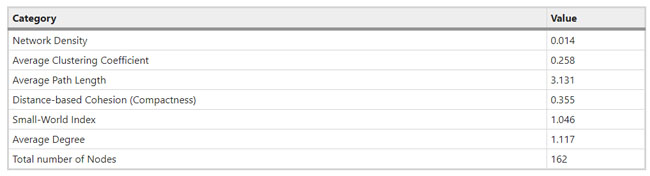
a, Dates of exposure, illness onset and sampling and real-time RT–PCR results of nasopharyngeal swabs and rectal swabs. The total number of patients was n = 10 and real-time RT–PCR was assayed only once for one type of sample at one time point from one independent patient. Colors in the figure represent individual patients. b, Chronological changes in Ct values of Orf1ab and N genes using real-time RT–PCR after hospital admission. The Ct values of Orf1ab and N genes on real-time RT–PCR detected in rectal swabs obtained from n = 10 independent patients (i) and Ct values in nasopharyngeal swabs from n = 10 independent cases (ii). The Ct value is supposed to be inversely related to viral RNA copy numbers and a value of 40 means the virus is molecularly undetectable. News | 11 March 2020 나이지리아의 COVID-19 대응: 아프리카 사하라 이남에서 첫 확진 사례 발생 공중보건연구소는 나이지리아는 비록 아직 해결해야 할 지역별 문제들이 남아있지만, COVID-19에 대응할 수 있는 유리한 상황에 있다고 말한다. Nigeria responds to COVID-19; first case detected in sub-Saharan Africa A seasoned public-health institute puts Nigeria in a good position to respond to COVID-19, although there are area-specific challenges to be addressed. https://www.nature.com/articles/d41591-020-00004-2 Correspondence | 10 March 2020 COVID-19: WHO가 대만에 대한 입장을 재고할 시기 COVID-19: time for WHO to reconsider its stance towards Taiwan https://www.nature.com/articles/d41586-020-00693-2 Correspondence | 10 March 2020 최신 코로나바이러스 연구는 계속되어야 한다. Keep up with the latest coronavirus research https://www.nature.com/articles/d41586-020-00694-1 News | 9 March 2020 실험실에서 유전자 조작 동물의 코로나바이러스 연구를 서두르고 있지만 일부 연구 인력이 부족하다. 원래 SARS 연구를 위해 만들어진 쥐 모델의 수요가 많은 편이다. Labs rush to study coronavirus in transgenic animals — some are in short supply Mice originally bred for SARS research are in high demand. https://www.nature.com/articles/d41586-020-00698-x Comments and Opinion | 9 March 2020 코로나바이러스와의 싸움에서 우리는 인간의 편견 또한 이겨 내야 한다. 발병의 복합적인 요소는 일반 대중이 사실을 오해하고 음모론을 만들어내서다. In the fight against the new coronavirus outbreak, we must also struggle with human bias A compounding factor of the outbreak is the potential for the general public to misunderstand the facts and design conspiracy theories. https://www.nature.com/articles/s41591-020-0802-y Research | 9 March 2020 2015년 한국의 메르스-CoV 확산-접촉 네트워크의 위상적 역학관계 Topological dynamics of the 2015 South Korea MERS-CoV spread-on-contact networks https://www.nature.com/articles/s41598-020-61133-9 Table 1 Structural properties of personal contact network.
Figure 1 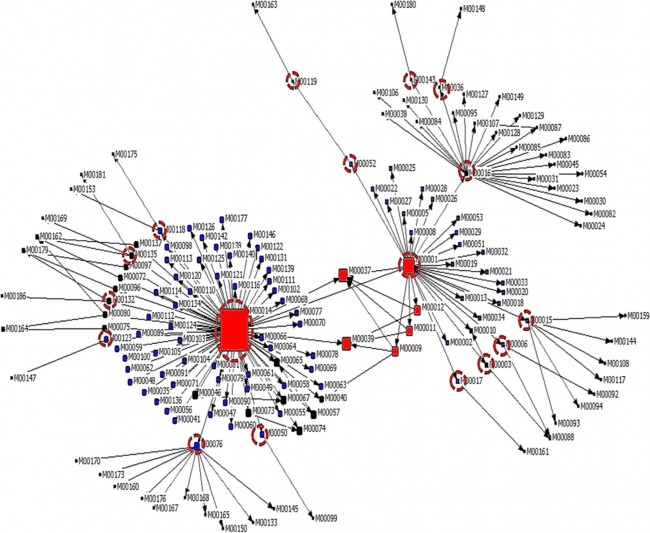 Personal Contact Patterns in MERS Infection Transmission. The overall relations of infection transmission within the personal contact network; three connected sub-structures are identified with the k-core algorithm. A k-core is defined as a hierarchical set of hosts based on a range for each number of contacts they each have according to the degree of connection the hosts have in the network. All nodes represent hosts having contacted MERS infection. Thus, all hosts that generated a given transmission event to k other hosts form a sub-structure, and any host that generated multiple transmission events will link multiple sub-structures. Colors correspond to the k-core partition (red: the first, blue: the second, black: the third group) and the size of the nodes in each k-core is proportional to the individual node eigenvector centrality values. Table 2 Centrality measure scores and descriptive statistics for the top-5 ranked hosts. 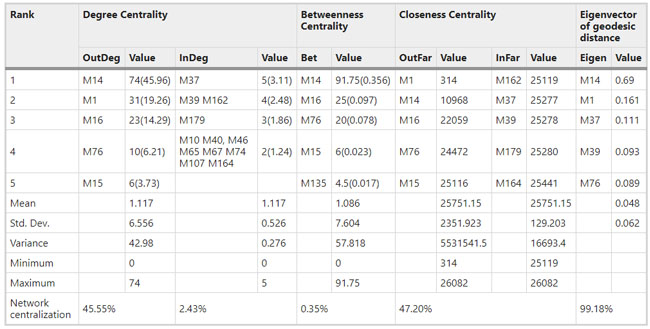 Table 3 Egocentric structural metrics for the top-5 highest degree infectious hosts. 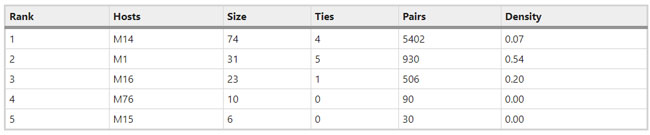 Table 4 Density matrix for categorical core-periphery model. 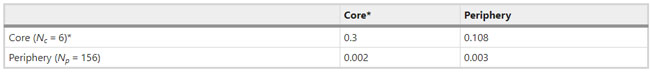 Figure 2 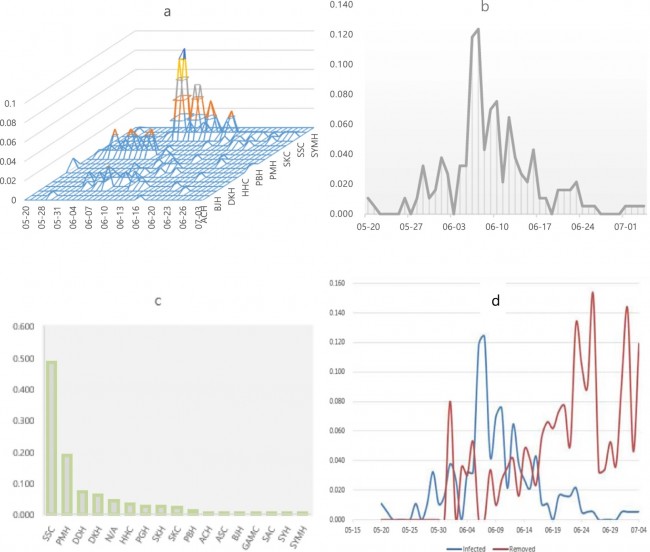 Distribution of MERS introductions as a function of time and place. (a), The posterior distribution for both date and place of MERS infection in 16 major healthcare facilities between May and July 2015. (b), The posterior distribution for time (date) of MERS introductions. (c), The posterior distribution for place (healthcare facilities) of MERS introductions. (d), The posterior distribution for MERS introductions and recoveries. *ACH (Asan Choongmoo Hospital, Asan, located in the centralwest of Korea); ASC (Asan Seoul Clinic, Asan); BJH (Joeun Gang-An Hospital, Busan, southeast); DDH (Dae Cheong Hospital, Daejeon, central); DKH (KonYang University Hospital, Daejeon); GAMC (Gangneung Medical Center, Gangneung, east central); HHC (Hallym University Medical Center, Hwaseong, northwest), PBH (Pyeongtaek Bagae Hospital, Pyeongtaek, northwest); PGH (Pyeongtaek Goodmorning Hospital, Pyeongtaek); PMH (Pyeongtaek St. Mary’s Hospital, Pyeongtaek); SAC (Seoul Asan Medical Center, Seoul, northwest); SKC (KonKuk University Medical Center, Seoul); SKH (KyungHee University Hospital at Gangdong, Seoul); SSC (Samsung Medical Center, Seoul); SYH (365 Seoul Yeol Lin Hospital, Seoul); SYMH (Yeoido St. Mary’s Hospital, Seoul). Table 5 Centrality measure scores for the top-20 hospital contacts. 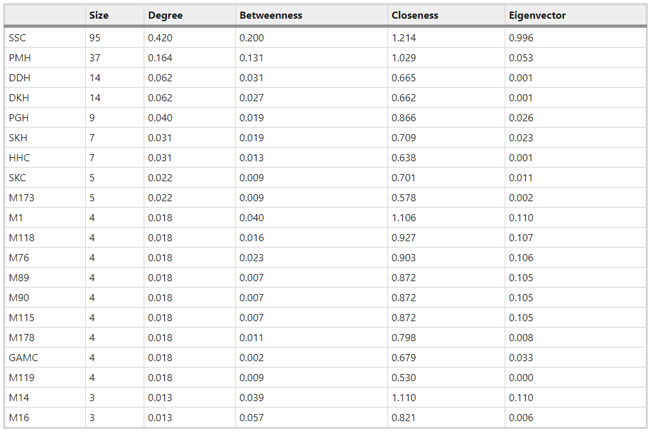 Figure 3 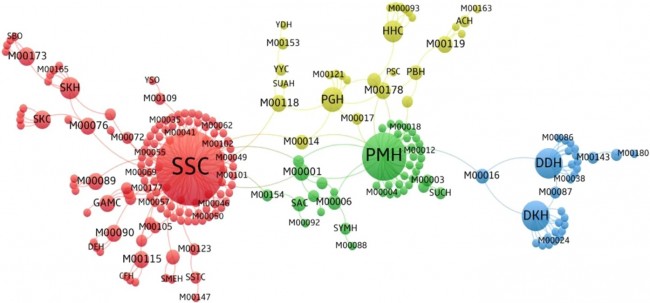 Bipartite graph of MERS infection transmission (hosts-by-hospitals). Structural layout of the network clustered together by different co-occurrence frequency levels of individual hosts and healthcare facilities (small clusters are merged into larger clusters based on modularity function), where red, green and blue nodes denote core nosocomial linkages, and yellow nodes denote periphery linkages. Image was created using VOSviewer. Table 6 Density matrix for the 2-mode categorical core-periphery model. 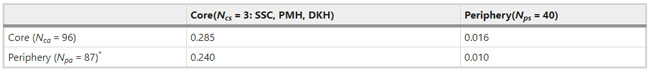 *Hosts #2, #133, and #145 were exempted fromhospital-acquired infections. News | 6 March 2020 미국에서 코로나바이러스 전염의 가장 큰 확산을 해결하기 위한 경쟁 The race to unravel the biggest coronavirus outbreak in the United States Editorial | 13 March 2020 식물 방어 재배치 전염병은 새로운 현상은 아니지만 현대 사회에서의 쉬운 접촉으로 확산이 가속화되었다. 이러한 현상은 일부 식물 요법을 통해 감염을 줄이는 데 도움이 될 수도 있다. Redeploying plant defences Epidemic diseases are not a new phenomenon, but easy access to transport in the modern world has accelerated their spread. Perhaps some botanical understanding can help slow them down. News | 6 March 2020 코로나바이러스는 왜 사람 간 쉽게 전파되는가? 연구자들은 병원균을 사스 바이러스보다 더 감염시킬 수 있는 미세한 특징을 발견하여 약물 표적으로 사용 Why does the coronavirus spread so easily between people? Researchers have identified microscopic features that could make the pathogen more infectious than the SARS virus — and serve as drug targets. Comments and Opinion | 6 March 2020 SARS-CoV-2 폐렴 발생으로 바이러스 백신이 요구됨. The outbreak of SARS-CoV-2 pneumonia calls for viral vaccines Table 1 Advantages and disadvantages of different vaccine strategies. 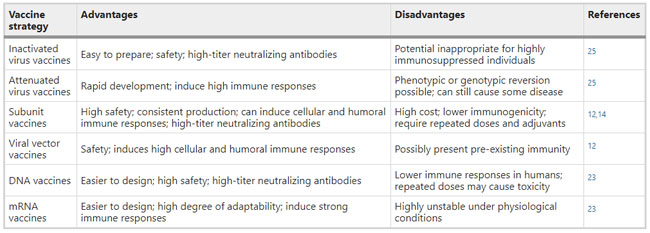 Research | 6 March 2020 급성 호흡기 감염 진단을 위한 새로운 바이오마커, 칼프로텍틴 Calprotectin, a new biomarker for diagnosis of acute respiratory infections Table 1 Patients with signs and symptoms of acute respiratory infections with confirmed etiology. 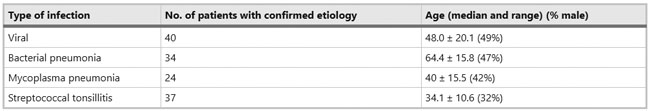 Viral respiratory disease: Influenza A (n = 19), RSV (n = 5), Influenza B (n = 4), CMV (n = 2), Rhinovirus (n = 2), VZV (n = 2), Coronavirus (n = 1), Parainfluenza (n = 1), Dengue (n = 1), HSV (n = 1). Bacterial pneumonia: Pneumococcus (Streptococcus pneumoniae) (n = 23) and H. influenzae (n = 11). Figure 1 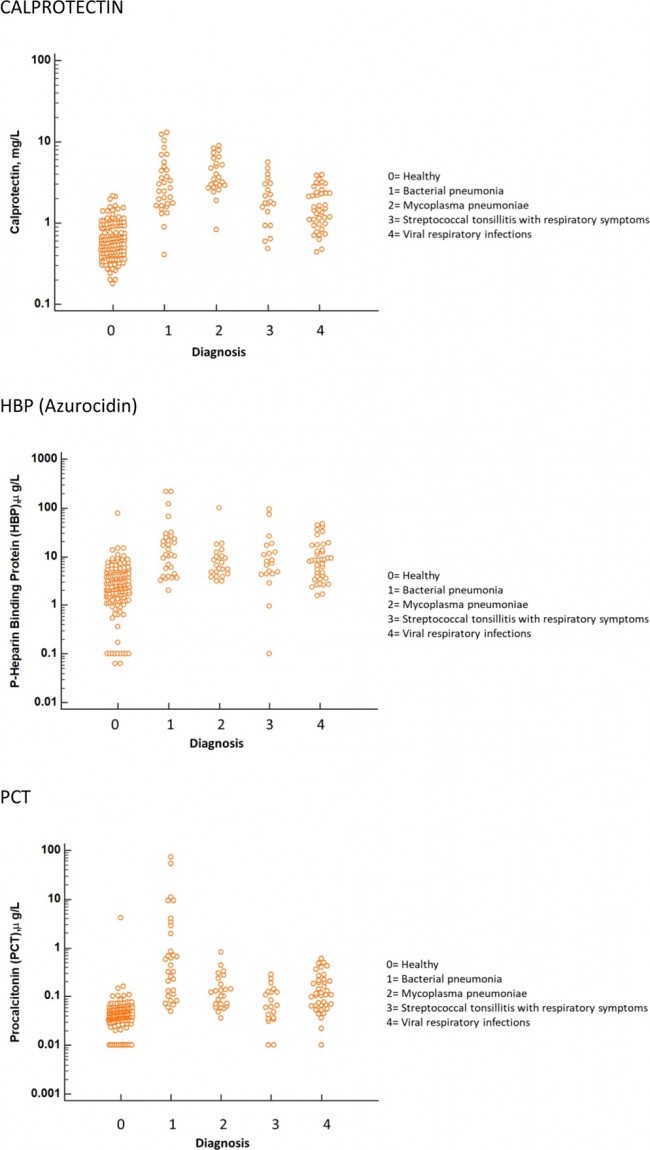 Biomarker concentrations in the different diagnostic groups, as indicated by the numbers. Top: Calprotectin, Middle: HBP (Azurocidin), Bottom: Procalcitonin. For all panels, only results with verified etiologies are presented. Table 2 Concentrations of the studied biomarkers and the possibility to differentiate between healthy population and infected patients (*) as well as between patients with bacterial and viral infections (z). 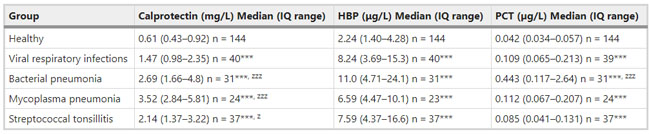 ***p < 0.001, bacterial, viral or mycoplasma infections vs healthy population. zzzp < 0.001, zp < 0.05, bacterial or mycoplasma infections vs viral infections. Figure 2 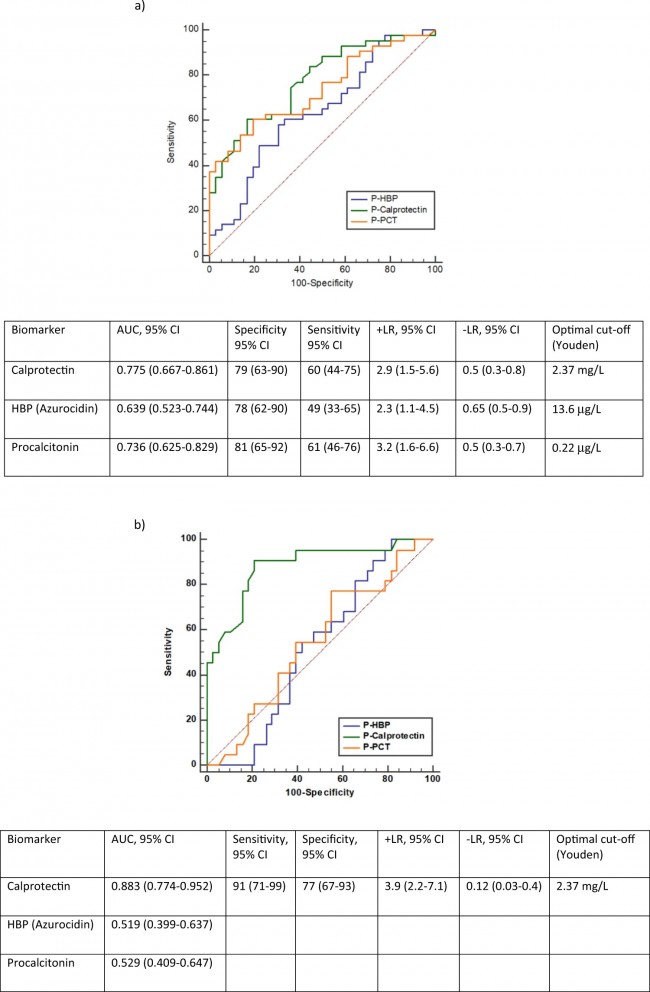 (a) Receiver operating characteristic curves, AUC, Sensitivity and Specificity of Calprotectin, HBP and Procalcitonin in the discrimination between patients with bacterial pneumonia and viral respiratory infections. (b) Receiver operating characteristic curves, AUC, Sensitivity and Specificity of Calprotectin, HBP and Procalcitonin in the discrimination between patients with mycoplasma pneumonia and viral respiratory infections. Table 3 The AUROC results for the three biomarkers are summarized for distinction between bacterial and mycoplasma pneumonia vs respiratory viral infections. 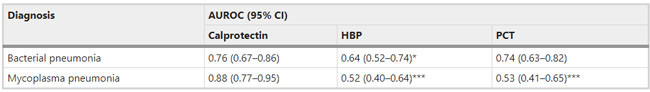 ***p<0.001, *p<0.05, calprotectin vs other biomarkers in differentiation between bacterial, mycoplasma and viral infections. Amendments and Corrections | 5 March 2020 저자 수정 내용: 코로나바이러스에 대한 중국의 대응은 2002년 SARS 발생 대응과는 극명한 대조를 이룬다. Author Correction: China’s response to a novel coronavirus stands in stark contrast to the 2002 SARS outbreak response News | 4 March 2020 코로나바이러스, 희미한 별이 밝게 빛나는 것처럼 우리에게도 희망이 생겼다? Coronavirus nixes conference, twilight zone beckons and a faded star brightens 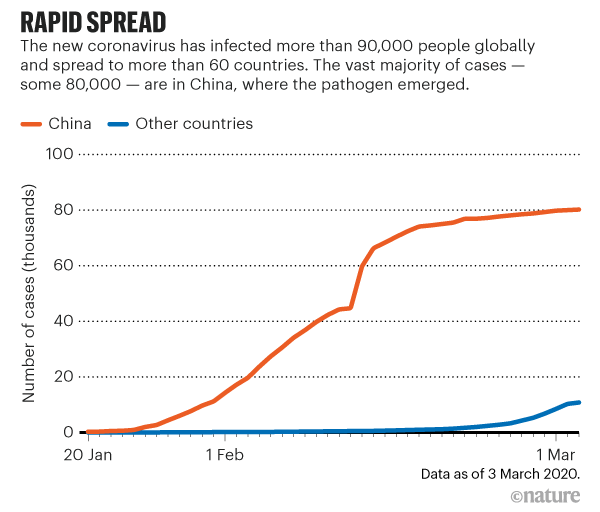 Source: Johns Hopkins Univ./https://go.nature.com/39LFREY Correspondence | 4 March 2020 사스-CoV-2는 사스-CoV와 비교했을 때, 새 항원 결정기가 스파이크 당단백질의 항원성이 우세함. Novel antibody epitopes dominate the antigenicity of spike glycoprotein in SARS-CoV-2 compared to SARS-CoV Figure 1 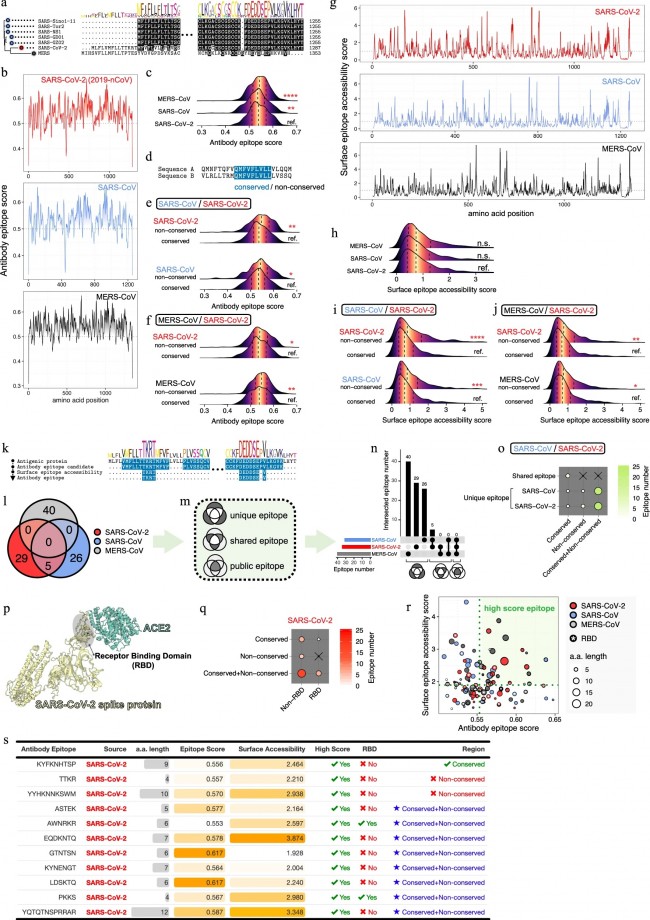 Antibody epitope analysis of spike proteins in MERS-CoV, SARS-CoV, and SARS-CoV-2 a Alignment and phylogenetic analysis of the amino acid sequences of spike proteins in SARS-CoV-2, MERS-CoV, and five representative SARS-CoVs (total sequence alignment in Supplementary Fig. 2). b Antibody epitope scores in spike proteins of MERS-CoV, SARS-CoV, and SARS-CoV-2; the grey dashed lines indicate the default threshold of antibody epitope scores. c Density plot of the distributions of antibody epitope scores in spike proteins of MERS-CoV, SARS-CoV, and SARS-CoV-2, with colors showing tail distribution probability, and the grey dashed lines representing the first, second, and third quartiles, respectively. The results were considered statistically significant when *P < 0.05, **P < 0.01, ***P < 0.001, and ****P < 0.0001 using Kruskal–Wallis test. d Illustration of conserved and non-conserved sequences. e Density plot of the distributions of antibody epitope scores in conserved and non-conserved sequences in the comparison between spike proteins from SARS-CoV and SARS-CoV-2. The results were considered statistically significant when *P < 0.05, **P < 0.01, ***P < 0.001, and ****P < 0.0001 using Wilcoxon’s signed-rank test. f The distributions of antibody epitope scores in conserved and non-conserved sequences in the comparison between spike proteins from MERS-CoV and SARS-CoV-2 using Wilcoxon’s signed-rank test. g Surface epitope accessibility scores in spike proteins of MERS-CoV, SARS-CoV, and SARS-CoV-2, the grey dashed lines indicate the default threshold of surface epitope accessibility scores. h The distributions of surface epitope accessibility scores in spike proteins of MERS-CoV, SARS-CoV, and SARS-CoV-2 using Kruskal–Wallis test. i The distributions of surface epitope accessibility scores in conserved and non-conserved sequences in the comparison between spike proteins from SARS-CoV and SARS-CoV-2 using Wilcoxon’s signed-rank test. j The distributions of surface epitope accessibility scores in conserved and non-conserved sequences in the comparison between spike proteins from MERS-CoV and SARS-CoV-2 using Wilcoxon’s signed-rank test. k Illustration of antibody epitope identification. l Venn plot of antibody epitopes in spike proteins of MERS-CoV, SARS-CoV, and SARS-CoV-2. m Illustration of analyzing intersected epitopes of unique, shared and public groups. n Plot of the number of intersected epitopes in spike proteins of MERS-CoV, SARS-CoV, and SARS-CoV-2. o Number of shared and unique epitopes from conserved, non-conserved, and the combination of conserved and non-conserved regions in the spike proteins of SARS-CoV and SARS-CoV-2. The color and size of cycles represent the number of epitopes, and the “×” represents no epitope could be found. p Structural model of the SARS-CoV-2 spike protein (yellow) in complex with its human cell receptor ACE2 (cyan). The model was superimposed using the structure of the SARS-CoV spike protein and ACE2 protein complex (PDB accession: 6ACJ) as template. The gray shadow represents the receptor-binding domain (RBD). q Number of epitopes located in RBD and non-RBD from conserved, non-conserved, and the combination of conserved and non-conserved regions in the SARS-CoV-2 spike protein. The color and size of cycles represent the number of epitopes, and the “×” represents no epitope could be found. r Plot of antibody epitope scores and surface epitope accessibility scores in the epitopes, each dot represent an epitope, the green dashed lines indicate the medians, respectively, the dot color represents the source of epitopes, the dot size represents the amino acid length of epitopes, the “*” represents the epitopes located in RBD, and the light green area shows the high-score epitopes. s Detail information of the high-score antibody epitopes from the SARS-CoV-2 spike protein |