뉴스브리핑센터
한의약융합데이터 콘텐츠 바로가기
동향분석
Home > 뉴스브리핑센터 > 동향분석


| SCIENCE에 실린 코로나19 (COVID-19) 아티클 소개 (~4/30) |
|
NEWS | Apr 30th, 2020 항바이러스제가 COVID-19 환자에 도움이 될 수 있다는 강력한 근거를 제시함 Large trial yields strongest evidence yet that antiviral drug can help COVID-19 patients By Jon Cohen RESEARCH AND REVIEWS. | Apr 30th, 2020 경구형 제재로 생체 이용가능한 광범위 항바이러스제는 사람 기도 상피세포 배양에서 사스-CoV-2를 억제하고, 쥐 모델에서 여러 코로나바이러스를 억제한다. An orally bioavailable broad-spectrum antiviral inhibits SARS-CoV-2 in human airway epithelial cell cultures and multiple coronaviruses in mice By Timothy P. Sheahan, et al. https://stm.sciencemag.org/content/12/541/eabb5883
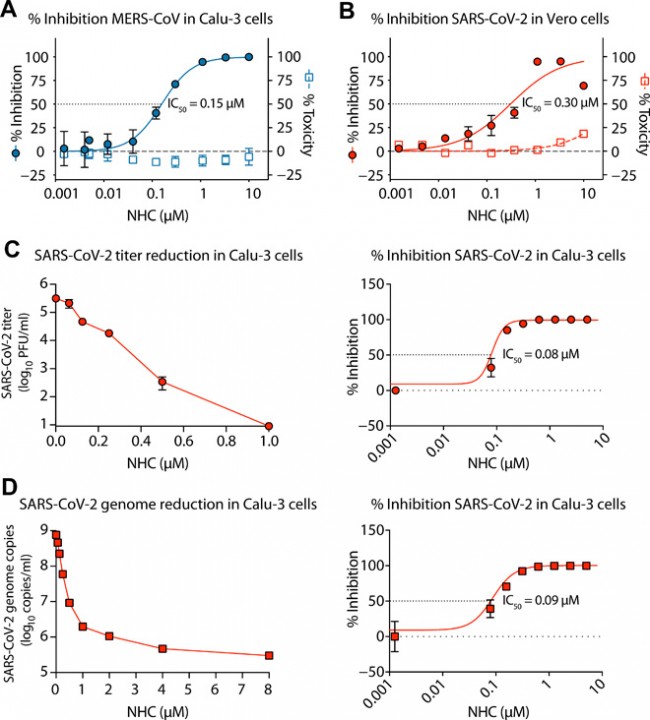
Fig. 1 NHC potently inhibits MERS-CoV and newly emerging SARS-CoV-2 replication. (A) Percent inhibition of MERS-CoV replication and NHC cytotoxicity in Calu-3 cells. Calu-3 cells were infected in triplicate with MERS-CoV nanoluciferase (MERS-nLUC) at a multiplicity of infection (MOI) of 0.08 in the presence of a range of drug for 48 hours, after which replication was measured through quantitation of MERS-CoV–expressed nLUC. Cytotoxicity was measured in similarly treated but uninfected cultures via CellTiter-Glo assay. Data are combined from three independent experiments. (B) NHC antiviral activity and cytotoxicity in Vero E6 cells infected with SARS-CoV-2. Vero E6 cells were infected in duplicate with SARS-CoV-2 clinical isolate 2019-nCoV/USA-WA1/2020 virus at an MOI of 0.05 in the presence of a range of drug for 48 hours, after which replication was measured through quantitation of cell viability by CellTiter-Glo assay. Cytotoxicity was measured as in (A). Data are combined from two independent experiments. (C) SARS-CoV-2 titer reduction (left) and percent inhibition (right) in Calu-3 cells. Cells were infected with SARS-CoV-2 at an MOI of 0.1 for 30 min, washed, and exposed to a dose response of NHC in triplicate per condition. At 72 hpi, virus production was measured by plaque assay. (D) SARS-CoV-2 genomic RNA reduction (left) and percent inhibition (right) in Calu-3 cells. Viral RNA was isolated from clarified supernatants from the study in (C). Genome copy numbers were quantitated by qRT-PCR with primer/probes targeting the N gene. For (A) to (D), the symbol is at the mean, and the error bars represent the SD.
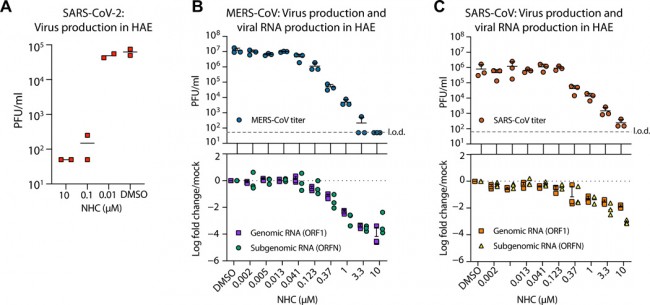
Fig. 2 NHC is highly active against SARS-CoV-2, MERS-CoV, and SARS-CoV in primary HAE cell cultures. (A) Human airway epithelia (HAE) cultures were infected at an MOI of 0.5 with clinical isolate SARS-CoV-2 for 2 hours in the presence of NHC in duplicate, after which the virus was removed, and cultures were washed in, incubated in NHC for 48 hours when apical washes were collected for virus titration by plaque assay. The line is at the mean. Each symbol represents the titer from a single well. (B) HAE cells were infected with MERS-CoV red fluorescent protein (RFP) at an MOI of 0.5 in triplicate and treated similarly to (A). qRT-PCR for MERS-CoV ORF1 and ORFN mRNA. Total RNA was isolated from cultures in (C) for qRT-PCR analysis. Representative data from three separate experiments with three different cell donors are displayed. PFU, plaque-forming units; l.o.d., limit of detection. (C) Studies performed as in (A) but with SARS-CoV green fluorescent protein (GFP). Representative data from two separate experiments with two different cell donors are displayed. Each symbol represents the data from one HAE culture, the line is at the mean, and the error bars represent the SD.
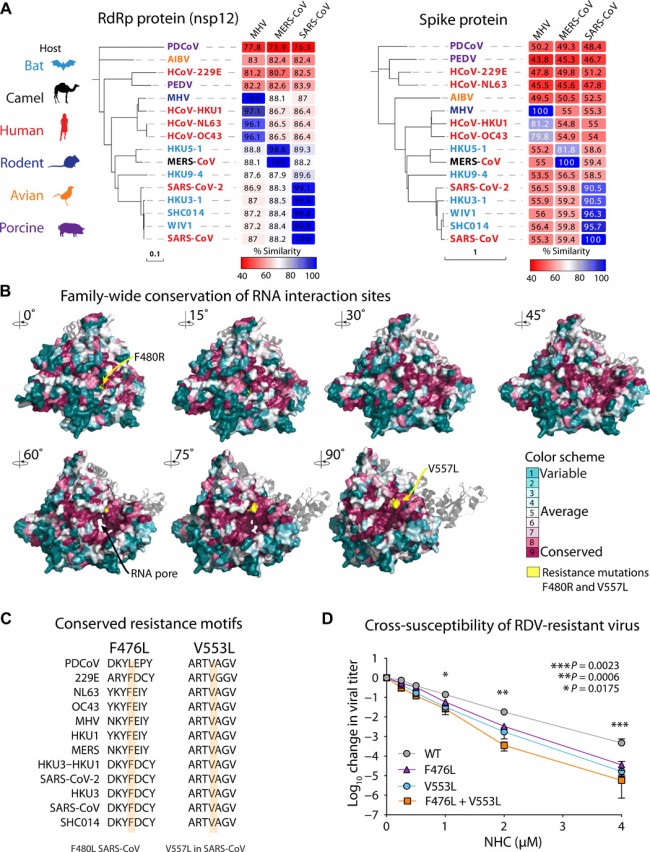
Fig. 3 Remdesivir resistance mutations in the highly conserved RdRp increase susceptibility to NHC. (A) Neighbor-joining trees created with representatives from all four CoV genogroups showing the genetic similarity of CoV nsp12 (RdRp) and CoV spike glycoprotein, which mediates host tropism and entry into cells. Text color of the virus strain label corresponds to virus host species on the left. The heat map adjacent to each neighbor-joining tree depicts percent amino acid identity (% amino acid similarity) against mouse hepatitis virus (MHV), SARS-CoV, or MERS-CoV. (B) The variation encompassed in (A) was modeled onto the RdRp structure of the SARS-CoV RdRp. (C) Amino acid sequence of CoV in (A) at known resistance alleles to antiviral drug remdesivir (RDV). (D) Virus titer reduction assay in DBT cells across a range of NHC with recombinant MHV bearing resistance mutations to RDV. Data shown are combined from three independent experiments performed with biological duplicates or triplicates per condition. Asterisks indicate statistically significant differences by Mann-Whitney test as indicated on the graph.
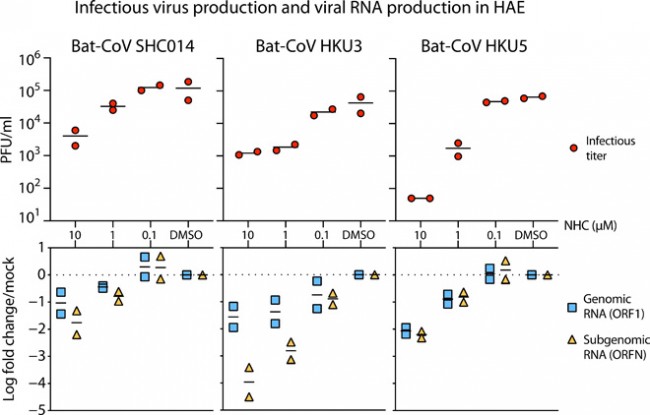
Fig. 4 NHC is effective against multiple genetically distinct bat-CoV. (Top) Antiviral efficacy of NHC in HAE cells against SARS-like (HKU3 and SHC014, group 2b) and MERS-like (HKU5, group 2c) bat-CoV. HAE cells were infected at an MOI of 0.5 in the presence of NHC in duplicate. After 48 hours, the virus produced was titrated via plaque assay. Each data point represents the titer per culture. (Bottom) qRT-PCR for CoV ORF1 and ORFN mRNA in total RNA from cultures in the top panel. Mock, mock treated. Representative data from two separate experiments with two different cell donors are displayed.
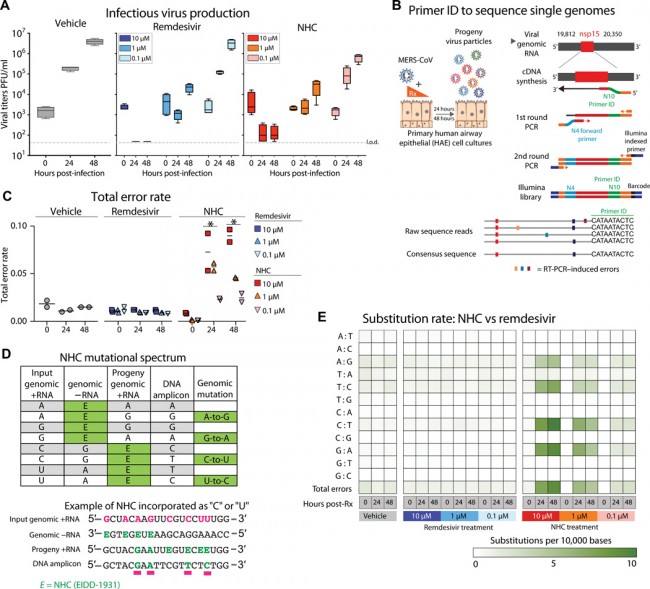
Fig. 5 NHC antiviral activity is associated with increased viral mutation rates. (A) HAE cultures were infected with MERS-CoV red fluorescent protein (RFP) at an MOI of 0.5 in duplicate in the presence of vehicle, RDV, or NHC for 48 hours, after which apical washes were collected for virus titration. Data are combined from two independent studies. The boxes encompass the 25th to 75th percentile, the line is at the median, and the whiskers represent the range. (B) Schematic of Primer ID deep sequencing for single RNA genomes of MERS-CoV. (C) The total error rate for MERS-CoV RNA isolated from cultures in (A) as determined by Primer ID. Error rate values are number of mutations per 10,000 bases. Asterisk indicates significant differences as compared to untreated group by two-way ANOVA with a Dunnett’s multiple comparison test. (D) Description of potential NHC mutational spectra on both positive- and negative-sense viral RNA. (E) Nucleotide transitions in cDNA were derived from MERS-CoV genomic RNA.
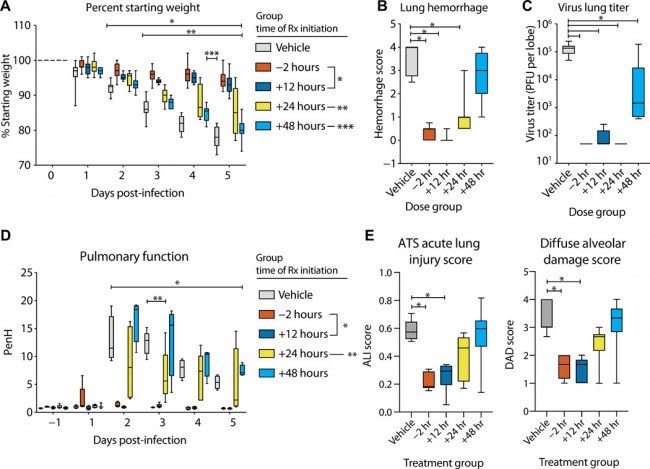
Fig. 6 Prophylactic and therapeutic EIDD-2801 reduces SARS-CoV replication and pathogenesis. Equivalent numbers of 25- to 29-week-old male and female C57BL/6 mice were administered vehicle (10% PEG and 2.5% Cremophor RH 40 in water) or NHC prodrug EIDD-2801 beginning at −2, +12, +24, or + 48 hpi and every 12 hours thereafter by oral gavage (n = 10 per group). Mice were intranasally infected with 1 × 10⁴ PFU mouse-adapted SARS-CoV MA15 strain. (A) Percent starting weight. Asterisks indicate differences from vehicle treated by two-way ANOVA with Tukey’s multiple comparison test. (B) Lung hemorrhage in mice from (A) scored on a scale of 0 to 4, where 0 is a normal pink healthy lung and 4 is a diffusely discolored dark red lung. (C) Virus lung titer in mice from (A) as determined by plaque assay. Asterisks in both (B) and (C) indicate differences from vehicle by one-way ANOVA with a Dunnett’s multiple comparison test. (D) Pulmonary function by whole-body plethysmography was performed daily on five animals per group. Asterisks indicate differences from vehicle by two-way ANOVA with a Dunnett’s multiple comparison test. (E) The histological features of acute lung injury (ALI) were blindly scored using an American Thoracic Society lung injury scoring system and a DAD scoring system. Three randomly chosen high-power (60×) fields of diseased lung were assessed per mouse. The numbers of mice scored per group: vehicle, n = 7; −2 hours, n = 9; +12 hours, n = 9; +24 hours, n = 10; +48 hours, n = 9. Asterisks indicate statistical significance compared to vehicle by Kruskal-Wallis with a Dunn’s multiple comparison test. For all panels, the boxes encompass the 25th to 75th percentile, the line is at the median, and the whiskers represent the range. *, −2 and +12 hours compared to vehicle; **, +24 hours compared to vehicle; ***, +48 hours compared to vehicle.
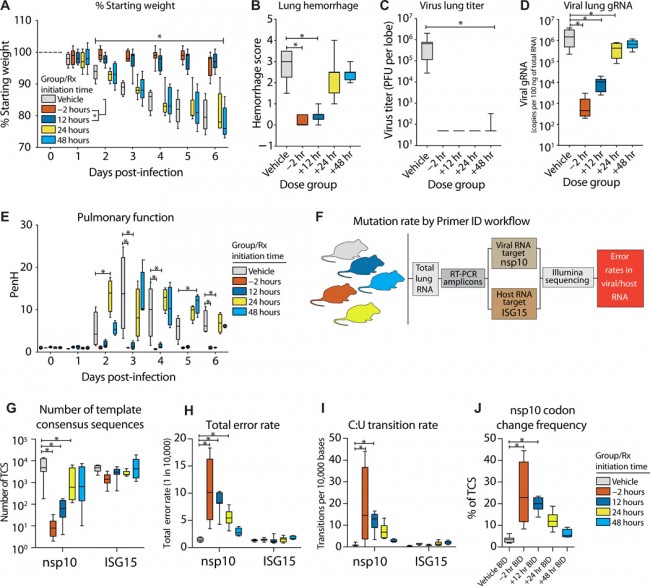
Fig. 7 Prophylactic and therapeutic EIDD-2801 reduces MERS-CoV replication and pathogenesis coincident with increased viral mutation rates. Equivalent numbers of 10- to 14-week-old male and female C57BL/6 hDPP4 mice were administered vehicle (10% PEG and 2.5% Cremophor RH 40 in water) or NHC prodrug EIDD-2801 beginning at −2, +12, +24, or +48 hpi and every 12 hours thereafter by oral gavage (n = 10 per group). Mice were intranasally infected with 5 × 10⁴ PFU mouse-adapted MERS-CoV M35C4 strain. (A) Percent starting weight. Asterisks indicate differences between −2- and +12-hour group from vehicle by two-way ANOVA with Tukey’s multiple comparison test. (B) Lung hemorrhage in mice from (A) scored on a scale of 0 to 4, where 0 is a normal pink healthy lung and 4 is a diffusely discolored dark red lung. (C) Virus lung titer in mice from (A) as determined by plaque assay. Asterisks in both (B) and (C) indicate differences from vehicle by Kruskal-Wallis with Dunn’s multiple comparison test. (D) MERS-CoV genomic RNA in lung tissue by qRT-PCR. Asterisks indicate differences by one-way ANOVA with a Dunnett’s multiple comparison test. (E) Pulmonary function by whole-body plethysmography was performed daily on four animals per group. Asterisks indicate differences from vehicle by two-way ANOVA with Tukey’s multiple comparison test. (F) Workflow to measure mutation rate in MERS-CoV RNA and host transcript ISG15 by Primer ID in mouse lung tissue. (G) Number of template consensus sequences (TCSs) for MERS-CoV nsp10 and ISG15. (H) Total error rate in MERS-CoV nsp10 and ISG15. (I) Cytosine to uridine transition rate in MERS-CoV nsp10 and ISG15. In (G) to (I), asterisks indicate differences from vehicle by two-way ANOVA with Tukey’s multiple comparison test. (J) Codon change frequency in MERS-CoV nsp10. Asterisks indicate differences from vehicle by Kruskal-Wallis with Dunn’s multiple comparison test. For all panels, the boxes encompass the 25th to 75th percentile, the line is at the median, and the whiskers represent the range. PERSPECTIVES AND COMMENTARY | Apr 30th, 2020 생존 COVID-19: 질병 내성 관점 Surviving COVID-19: A disease tolerance perspective https://advances.sciencemag.org/content/6/18/eabc1518 PERSPECTIVES AND COMMENTARY | Apr 30th, 2020 COVID-19를 위한 ACE 치료법 An ACE therapy for COVID-19 By Christopher B. Rodell https://stm.sciencemag.org/content/12/541/eabb5676 NEWS | Apr 29th, 2020 왜 몇몇 코로나바이러스 환자들은 놀랄 정도로 낮은 산소 수치를 감지하지 못하는가? Why don’t some coronavirus patients sense their alarmingly low oxygen levels? By Jennifer Couzin-Frankel NEWS | Apr 25th, 2020 첫 항체 조사에서 품질, 편향에 대한 논란 First antibody surveys draw fire for quality, bias By Gretchen Vogel https://science.sciencemag.org/content/368/6489/350 NEWS | Apr 25th, 2020 NIH는 최우선 치료와 백신 시험을 위한 약물을 찾기위해 도움 NIH organizes hunt for drugs By Jocelyn Kaiser https://science.sciencemag.org/content/368/6489/351 NEWS | Apr 25th, 2020 신체를 관통하다 A rampage through the body By Meredith Wadman, et al. https://science.sciencemag.org/content/368/6489/356
PERSPECTIVES AND COMMENTARY | Apr 25th, 2020 사스-CoV-2의 핵심 효소 공략 Targeting a key enzyme in SARS-CoV-2 By Michael Funk, et al. https://science.sciencemag.org/content/368/6489/381.6 RESEARCH AND REVIEWS | Apr 25th, 2020 SARS-CoV-2 주요 프로테아제의 결정 구조는 개선된 α-케토아미드 억제제 설계의 기초를 제공한다. Crystal structure of SARS-CoV-2 main protease provides a basis for design of improved α-ketoamide inhibitors By Linlin Zhang, et al. https://science.sciencemag.org/content/368/6489/409
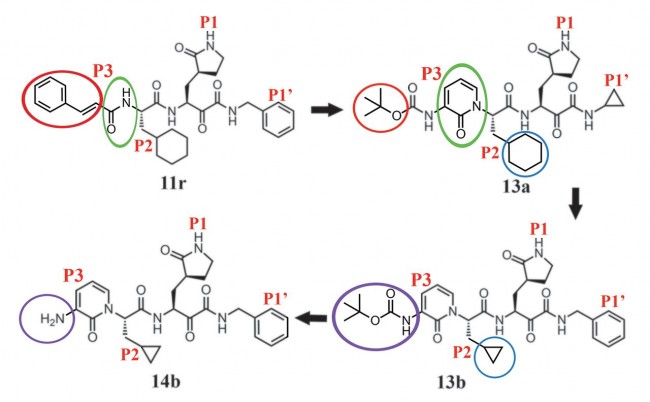
Fig. 1 Chemical structures of α-ketoamide inhibitors 11r, 13a, 13b, and 14b. Colored ovals and circles highlight the modifications from one development step to the next (see text).
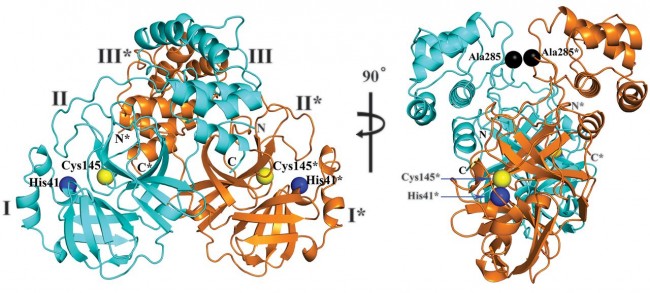
Fig. 2 Three-dimensional structure of SARS-CoV-2 Mpro in two different views. One protomer of the dimer is shown in light blue, the other one in orange. Domains are labeled by Roman numerals. Amino acid residues of the catalytic site are indicated as yellow spheres for Cys145 and blue spheres for His41. Asterisks mark residues from protomer B (orange). Black spheres indicate the positions of Ala285 for each of the two domains III (see text). Chain termini are labeled N and C for molecule A (light blue) and N* and C* for molecule B (orange).
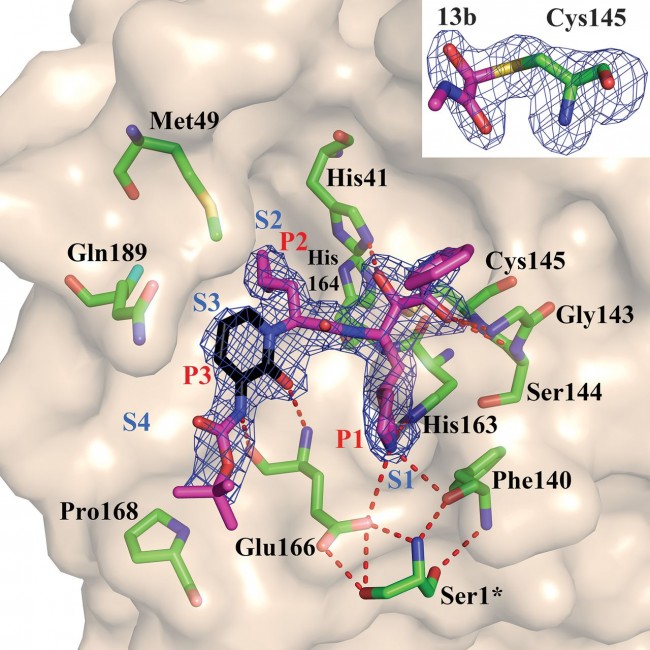
Fig. 3 Compound 13b in the substrate-binding cleft located between domains I and II of the Mpro in the monoclinic crystal form (space group C2). Fobs – Fcalc density is shown for the inhibitor (contouring level 3σ). Carbon atoms of the inhibitor are magenta, except in the pyridone ring, which is black; oxygen atoms are red, nitrogens blue, and sulfur yellow. Light blue symbols Sn (n = 1, 2, 3…) indicate the canonical binding pockets for moieties Pn (n = 1, 2, 3…) (red symbols) of the peptidomimetic inhibitor. Hydrogen bonds are indicated by dashed red lines. Note the interaction between Ser1*, the N-terminal residue of molecule B, and Glu166 of molecule A, which is essential for keeping the S1 pocket in the correct shape and the enzyme in the active conformation. Inset: Thiohemiketal formed by the nucleophilic attack of the catalytic cysteine onto the α-carbon of the inhibitor. The stereochemistry of the α-carbon is S. Fobs − Fcalc density (contoured at 3σ) is shown in blue. See fig. S9 for more details.
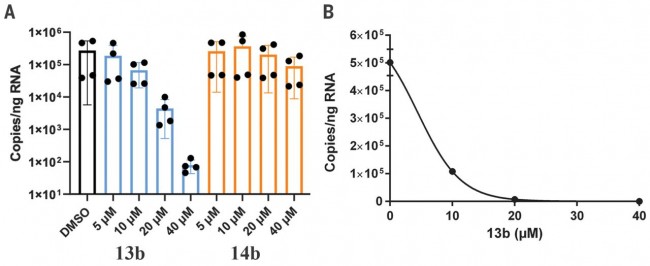
Fig. 4 Compound 13b inhibits SARS-CoV-2 replication in human Calu-3 lung cells. (A) Calu-3 cells were infected with SARS-CoV-2 using a multiplicity of infection (MOI) of 0.05. Varying amounts (5, 10, 20, or 40 μM) of 13b (blue bars) or 14b (orange bars) were added. DMSO was used as vehicle control (black bar). Total RNA was isolated from cell lysates, and viral RNA content was analyzed by quantitative polymerase chain reaction. Data are means ± SD of two biological experiments with two technical replicates each. (B) For the estimation of the EC50 value of compound 13b against SARS-CoV-2, a dose-response curve was prepared (GraphPad). NEWS | Apr 24th, 2020 중국 생명공학 보고서는COVID-19 백신으로 원숭이를 신종 코로나바이러스로부터 보호한다고 발표했다. COVID-19 vaccine protects monkeys from new coronavirus, Chinese biotech reports By Jon Cohen PERSPECTIVES AND COMMENTARY | Apr 23rd, 2020 세포 치료법이 COVID-19 중증 환자들의 사이토카인 폭풍을 막을 수 있을까? Can cell therapies halt cytokine storm in severe COVID-19 patients? By James Ankrum https://stm.sciencemag.org/content/12/540/eabb5673 RESEARCH ARTICLE | Apr 22nd, 2020 SARS-CoV-2 주요 프로테아제를 대상으로 한 항바이러스제 후보 물질의 구조 설계 Structure-based design of antiviral drug candidates targeting the SARS-CoV-2 main protease https://science.sciencemag.org/content/early/2020/04/21/science.abb4489
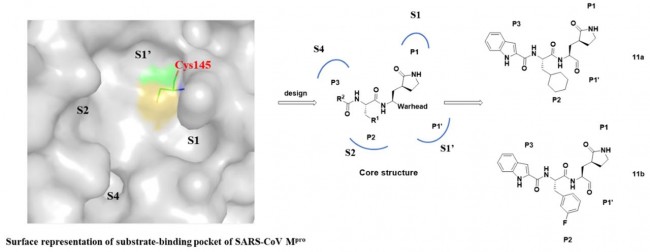
Fig. 1 Design strategy of novel SARS-CoV-2 main protease inhibitors and the chemical structures of 11a and 11b.
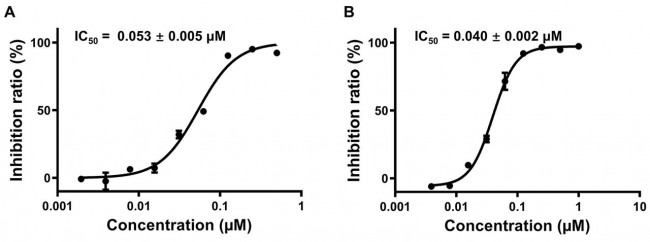
Fig. 2 Inhibitory activity profiles of compounds 11a (A) and 11b (B) against SARS-CoV-2 Mpro.
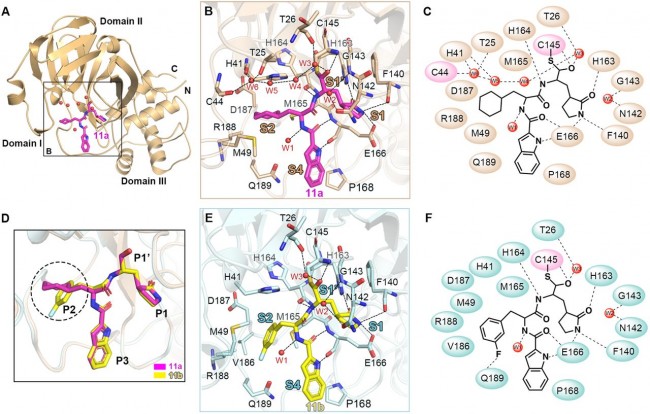
Fig. 3 Mpro-inhibitor binding modes for 11a and 11b. (A) Cartoon representation of the crystal structure of SARS-CoV-2 Mpro in complex with 11a. The compound 11a is shown as magenta sticks; water molecules shown as red spheres. (B) Close-up view of the 11a binding pocket. Four subsites, S1′, S1, S2 and S4, are labeled. The residues involved in inhibitor binding are shown as wheat sticks. 11a and water molecules are shown as magenta sticks and red spheres, respectively. Hydrogen bonds are indicated as dashed lines. (C) Schematic diagram of SARS-CoV-2 Mpro-11a interactions shown in (B). (D) Comparison of the binding modes between 11a and 11b for SARS-CoV-2 Mpro. The major differences between 11a and 11b are marked with dashed circles. The compounds of 11a and 11b are shown as magenta and yellow sticks, respectively. (E) Close-up view of the 11b binding pocket. Hydrogen bonds are indicated as dashed lines. (F) Schematic diagram of SARS-CoV-2 Mpro-11b interactions shown in (E).
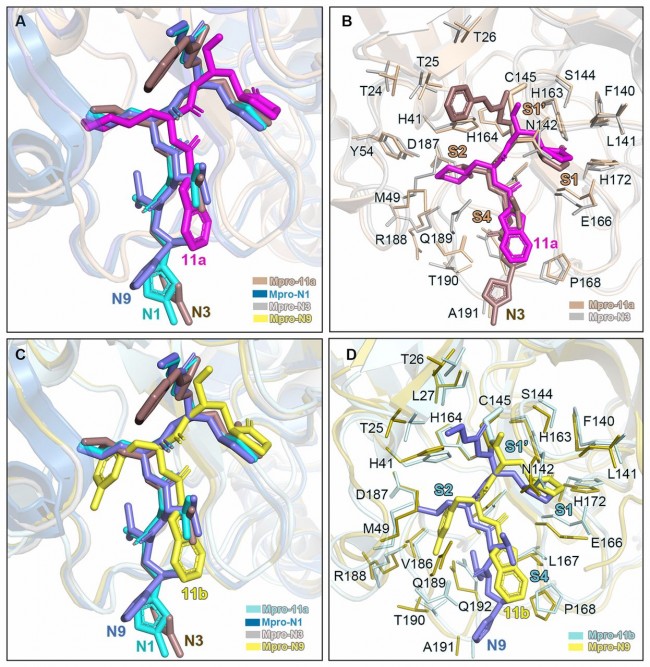
Fig. 4 Comparison of the inhibitor binding modes in SARS-CoV and SARS-CoV-2 Mpros. (A) Comparison of binding modes of 11a in SARS-CoV-2 Mpro with those of N1, N3 and N9 in SARS-CoV Mpro. SARS-CoV-2 Mpro-11a (wheat, PDB code: 6LZE), SARS-CoV Mpro-N1 (sky blue, PDB code:1WOF), SARS-CoV Mpro-N3 (gray, PDB code: 2AMQ) and SARS-CoV Mpro-N9 (olive, PDB code: 2AMD).11a, N1, N3 and N9 are shown in magenta, cyan, dirty violet and salt, respectively. (B) Comparison of the 11a and N3 binding pockets. Residues in Mpro-11a structure and Mpro-N3 structure are colored in wheat and gray, respectively. 11a and N3 are shown as sticks colored in magenta and dirty violet, respectively. (C) Comparison of binding modes of 11b in SARS-CoV-2 Mpro with those of N1, N3 and N9 in SARS-CoV Mpro. SARS-CoV-2 Mpro-11b (pale cyan, PDB code: 6M0K). 11b, N1, N3 and N9 are shown in yellow, cyan, dirty violet and salt, respectively. (D) Comparison of the 11b and N9 binding pockets. Residues in Mpro-11b structure and Mpro-N9 structure are colored in pale cyan and olive, respectively. 11b and N9 are shown as sticks colored in yellow and salt, respectively.
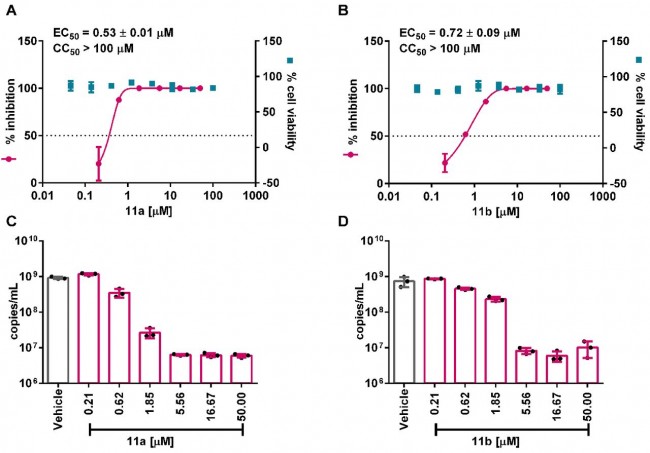
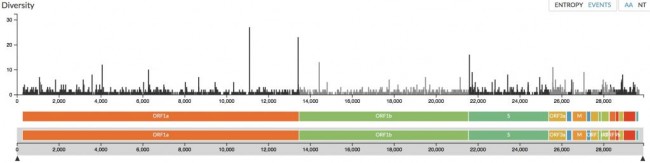
Fig. 5 In vitro inhibition of viral main protease inhibitors against SARS-CoV-2. (A and B) Vero E6 cells were treated with a series concentration of indicated compounds 11a and 11b and infected with SARS-CoV-2 at an MOI of 0.05. At 24 hours post infection, viral yield in the cell supernatant was quantified by plaque assay. The cytotoxicity of these compounds in Vero E6 cells was also determined by using CCK8 assays. The left and right Y-axis of the graphs represent mean % inhibition of virus yield and mean % cytotoxicity of the drugs, respectively. (C and D) Viral RNA copy numbers in the cell supernatants were quantified by qRT-PCR. Data are mean ± SD, n = 3 biological replicates. BLOGS | Apr 22nd, 2020 코로나바이러스에서 돌연변이 관찰 Watching For Mutations in the Coronavirus By Derek Lowe https://blogs.sciencemag.org/pipeline/archives/2020/04/21/watching-for-mutations-in-the-coronavirus
NEWS | Apr 22nd, 2020 COVID-19에 대해 널리 사용되는 말라리아 예방법은 심장마비의 위험을 높인다. 의사들은 어떻게 위험을 최소화할 수 있을까? Antimalarials widely used against COVID-19 heighten risk of cardiac arrest. How can doctors minimize the danger? By Kelly Servick NEWS | Apr 22nd, 2020 방대한 수의 코로나바이러스 감염을 나타내는 항체 조사는 신뢰할 수 있을까? Antibody surveys suggesting vast undercount of coronavirus infections may be unreliable By Gretchen Vogel EDITORIAL | Apr 21st, 2020 코로나 시대의 의학: 근본적인 분자 연구는 "필수적"이다. Medicine in the time of corona: Fundamental molecular research is “essential” By Ali Shilatifard https://advances.sciencemag.org/content/early/2020/04/21/sciadv.abc2800 EDITORIAL | Apr 20th, 2020 WHO는 왜? Why WHO? By H. Holden Thorp https://science.sciencemag.org/content/early/2020/04/20/science.abc3400 NEWS | Apr 18th, 2020 코로나바이러스는 사람을 어떻게 죽일까? 임상의는 뇌에서 발끝까지 몸 전체를 맹렬히 날뛰는 바이러스를 추적한다. How does coronavirus kill? Clinicians trace a ferocious rampage through the body, from brain to toes By Meredith Wadman, et al. NEWS | Apr 18th, 2020 생쥐에서 원숭이까지 코로나바이러스에 대한 동물 연구 From mice to monkeys, animals studied for coronavirus answers By Jon Cohen https://science.sciencemag.org/content/368/6488/221 NEWS | Apr 17th, 2020 COVID-19 합병증에 대한 항생제 치료는 내성 박테리아를 연료로 만들 수 있다. Antibiotic treatment for COVID-19 complications could fuel resistant bacteria By Sara Reardon BLOGS | Apr 17th, 2020 4월 16일 기준 Covid-19에 대한 더 작은 분자 임상 데이터 More Small Molecule Clinical Data Against Covid-19, As of April 16 By Derek Lowe EDITORIAL | Apr 17th, 2020 생존 COVID-19: 질병 내성 관점 Surviving COVID-19: A disease tolerance perspective By Janelle S. Ayres https://advances.sciencemag.org/content/early/2020/04/16/sciadv.abc1518 REPORT | Apr 17th, 2020 사람 이외의 영장류 모델에서 COVID-19, 메르스, 사스의 병원체 비교 Comparative pathogenesis of COVID-19, MERS and SARS in a non-human primate model By Barry Rockx et al. https://science.sciencemag.org/content/early/2020/04/16/science.abb7314
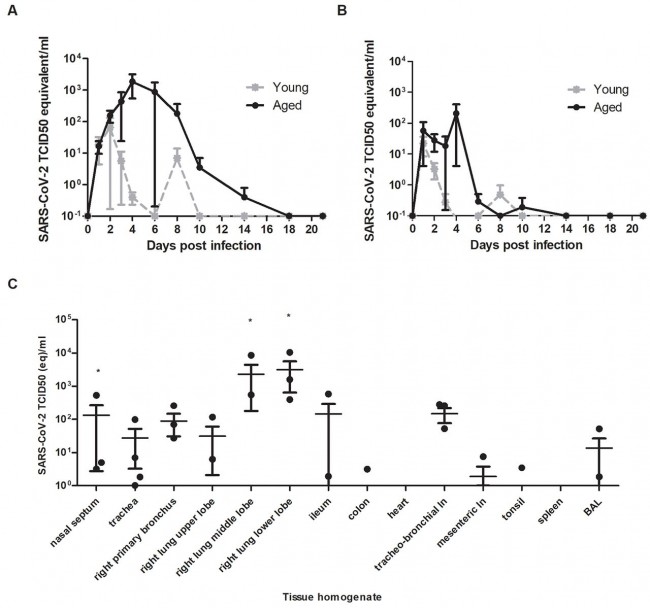
Fig. 1 Virus shedding and virus detection in organs of SARS-CoV-2 inoculated cynomolgus macaques. Viral RNA was detected in nasal (A) and throat (B) swabs and tissues (C) of SARS-CoV-2 infected animals by RT-qPCR. Samples from four animals (days 1-4) or two animals (days >4) per group were tested. The error bars represent the standard error of the mean. Virus was detected in tissues from two young, and two aged animals on day 4 by RT-qPCR.* = infectious virus was isolated.
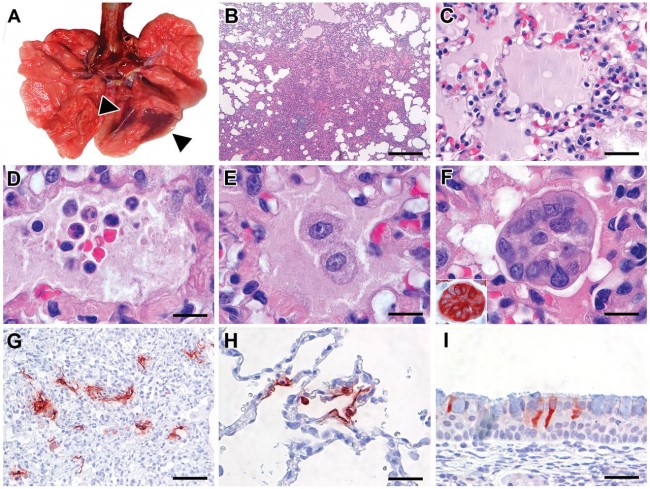
Fig. 2 Characteristic pathological changes and virus antigen expression in the lungs of SARS-CoV-2-inoculated cynomolgus macaques. (A) Two foci of pulmonary consolidation in the left lower lung lobe (arrowheads). (B) Area of pneumonia (HE, bar indicates 0.5 cm). (C) Edema fluid in alveolar lumina (HE, bar indicates 25 μm). (D) Neutrophils, as well as erythrocytes, fibrin, and cell debris, in an alveolar lumen flooded by edema fluid (HE, bar indicates 10 μm). (E) Mononuclear cells, either type II pneumocytes or alveolar macrophages, in an alveolar lumen flooded by edema fluid (HE, bar indicates 10 μm). (F) Syncytium in an alveolar lumen (HE, 100X objective). Inset: Syncytium expresses keratin, indicating epithelial cell origin (IHC for pankeratin AE1/AE3, bar indicates 10 μm). (G) SARS-CoV-2 antigen expression is colocalized with areas of diffuse alveolar damage (IHC for SARS-CoV-nucleocapsid, bar indicates 50 μm). (H) Type I (flat) and type II (cuboidal) pneumocytes in affected lung tissue express SARS-CoV-2 antigen (IHC for SARS-CoV-nucleocapsid, bar indicates 25 μm). (I) Ciliated columnar epithelial cells of respiratory mucosa in nasal cavity express SARS-CoV-2 antigen (IHC for SARS-CoV-nucleocapsid, bar indicates 25 μm).
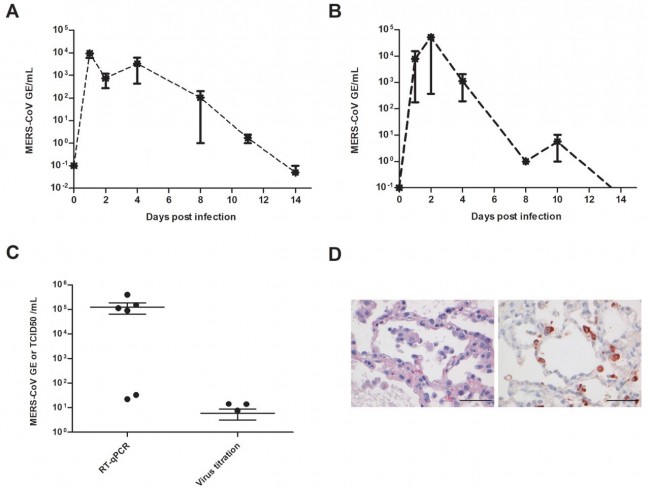
Fig. 3 Virus shedding and virus detection in organs of MERS-CoV inoculated cynomolgus macaques. Viral RNA was detected in nasal (A) and throat (B) swabs and tissues (C) of MERS-CoV infected animals by RT-qPCR. Samples from four animals per group were tested. The error bars represent the standard error of the mean. Virus was detected in tissues on day 4 by RT-qPCR. Histopathological changes (D; left picture) with hypertrophic and hyperplastic type II pneumocytes in the alveolar septa and increased numbers of alveolar macrophages in the alveolar lumina and virus antigen expression (right picture) in type II pneumocytes, bar indicates 50 μm. PERSPECTIVE | Apr 17th, 2020 중증 COVID-19의 사이토카인 방출 증후군 Cytokine release syndrome in severe COVID-19 By John B. Moore, Carl H. June https://science.sciencemag.org/content/early/2020/04/16/science.abb8925
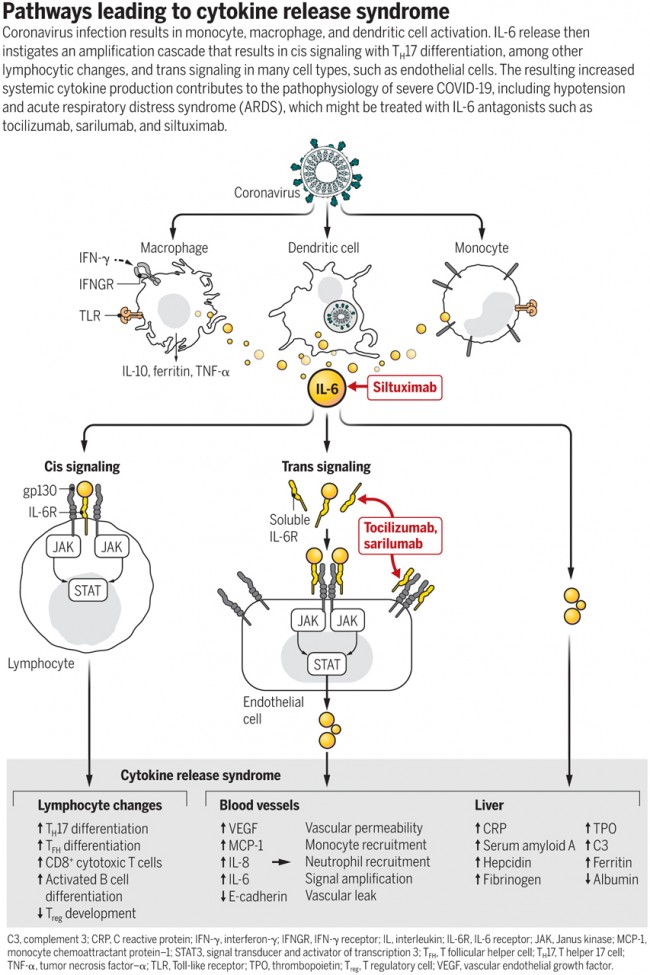
Pathways leading to cytokine release syndrome Coronavirus infection results in monocyte, macrophage, and dendritic cell activation. IL-6 release then instigates an amplification cascade that results in cis signaling with TH17 differentiation, among other lymphocytic changes, and trans signaling in many cell types, such as endothelial cells. The resulting increased systemic cytokine production contributes to the pathophysiology of severe COVID-19, including hypotension and acute respiratory distress syndrome (ARDS), which might be treated with IL-6 antagonists such as tocilizumab, sarilumab, and siltuximab. |