뉴스브리핑센터
한의약융합데이터 콘텐츠 바로가기
동향분석
Home > 뉴스브리핑센터 > 동향분석


| NATURE에 실린 코로나19 (COVID-19) 아티클 소개 (~4/30) |
|
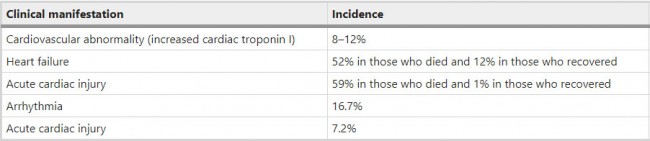
Correspondence | 30 April 2020 신종 코로나바이러스가 심혈관 질환에 미치는 영향 A novel COVID-19 and its effects on cardiovascular disease https://www.nature.com/articles/s41440-020-0461-x
Comments and Opinion | 30 April 2020 코로나바이러스 백신: 인류 최초 시험 기록 깨기 COVID-19 vaccines: breaking record times to first-in-human trials https://www.nature.com/articles/s41541-020-0188-3
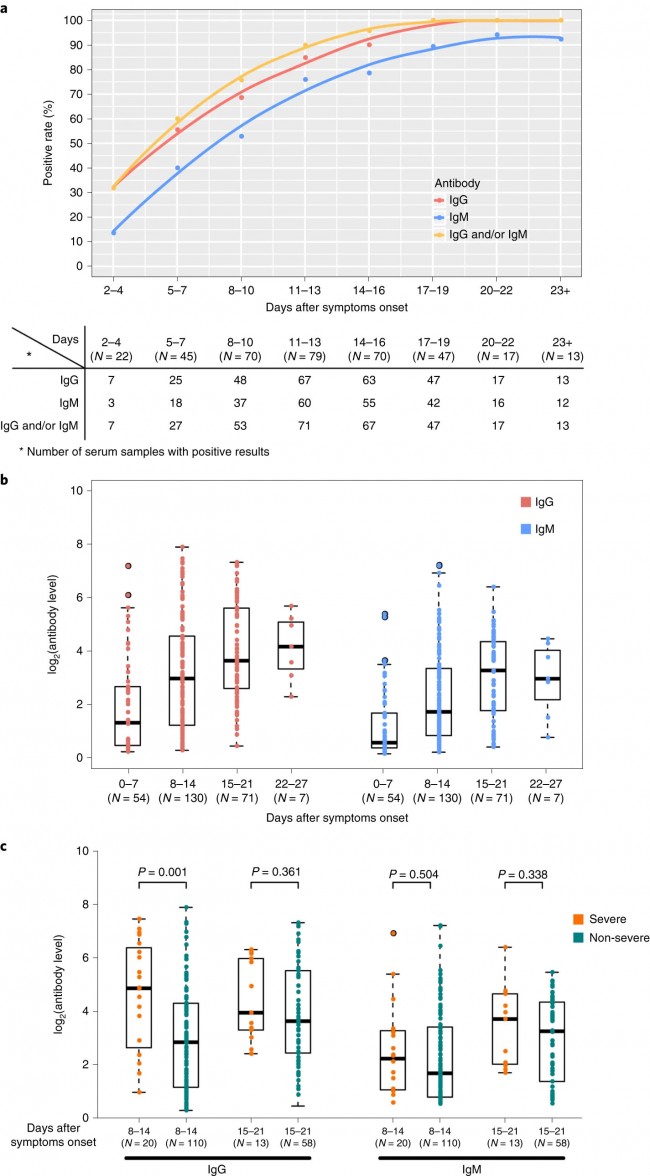
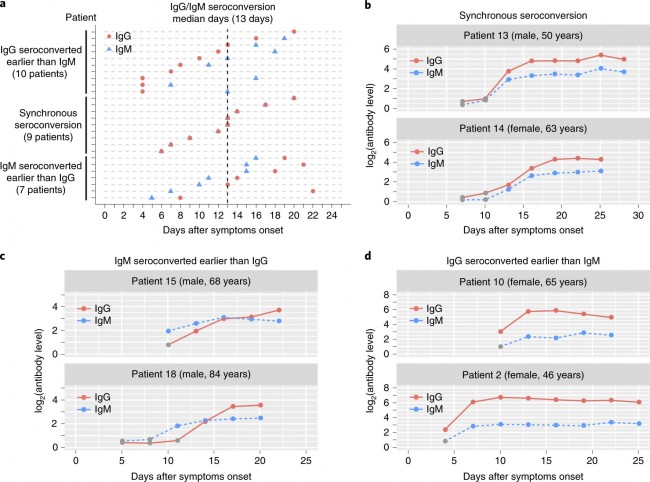
News | 30 April 2020 수십 개의 코로나바이러스 백신이 경쟁 중 - 과학자들은 어떻게 최고를 선택할 것인가? 개발자와 자금 제공자들은 효능 시험을 위한 토대를 마련하고 있지만 소수의 백신만이 성공할 가능성이 있다. Scores of coronavirus vaccines are in competition — how will scientists choose the best? Developers and funders are laying the groundwork for efficacy trials, but only a handful of vaccines are likely to make the cut. https://www.nature.com/articles/d41586-020-01247-2 Research | 30 April 2020 SARS-CoV-2 단백질 상호작용 맵은 약물 재창출 타겟을 밝힌다. A SARS-CoV-2 protein interaction map reveals targets for drug repurposing https://www.nature.com/articles/s41586-020-2286-9 Research Highlights | 30 April 2020 SARS-Cov-2-reactive T세포 (환자와 건강한 기증자의 경우) SARS-CoV-2-reactive T cells in patients and healthy donors https://www.nature.com/articles/s41577-020-0333-2 Research Highlights | 30 April 2020 사스-CoV-2에 대한 비활성 백신 Inactivated vaccine for SARS-CoV-2 https://www.nature.com/articles/s41577-020-0334-1 Research | 29 April 2020 COVID-19 환자에서 SARS-Cov-2 항체 반응 Antibody responses to SARS-CoV-2 in patients with COVID-19 https://www.nature.com/articles/s41591-020-0897-1 Fig. 1: Antibody responses against SARS-CoV-2.
a, Graph of positive rates of virus-specific IgG and IgM versus days after symptom onset in 363 serum samples from 262 patients. b, Levels of antibodies against SARS-CoV-2 in patients at different times after symptom onset. c, Comparison of the level of antibodies against SARS-CoV-2 between severe and non-severe patients. The boxplots in b and c show medians (middle line) and third and first quartiles (boxes), while the whiskers show 1.5× the interquartile range (IQR) above and below the box. Numbers of patients (N) are shown underneath. P values were determined with unpaired, two-sided Mann–Whitney U-test. Fig. 2: Seroconversion time of the antibodies against SARS-CoV-2.
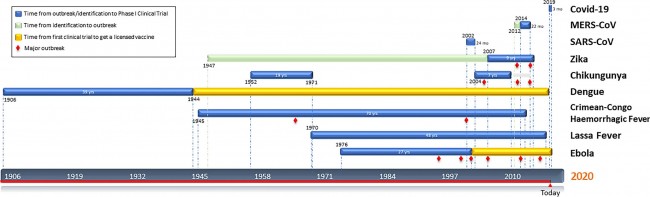
a, Seroconversion type of 26 patients who were initially seronegative during the observation period. The days of seroconversion for each patient are plotted. b–d, Six representative examples of the three seroconversion type: synchronous seroconversion of IgG and IgM (b), IgM seroconversion earlier than that of IgG (c) and IgM seroconversion later than that of IgG (c). Research Highlights | 29 April 2020 COVID-19: 중증 환자 치료 및 관리 COVID-19: treating and managing severe cases https://www.nature.com/articles/s41422-020-0329-2 News | 29 April 2020 코로나바이러스 치료제로 렘데시비르에 대한 희망이 높아지고 있다. 상반되는 연구에도 불구하고, 최대 규모의 시험 결과는 항바이러스 치료의 속도를 높여 미국의 치료 표준으로 자리잡게 한다는 것을 보여준다. Hopes rise for coronavirus drug remdesivir Despite conflicting studies, results from largest trial yet show the antiviral speeds up recovery, putting it on track to become a standard of care in the United States. https://www.nature.com/articles/d41586-020-01295-8 Amendments and Corrections | 29 April 2020 교정: 림프구감소증은 COVID-19의 질병 심각도를 예측한다: 기술적이고 예측 가능한 연구 Correction: Lymphopenia predicts disease severity of COVID-19: a descriptive and predictive study https://www.nature.com/articles/s41392-020-0159-1 Reviews | 28 April 2020 COVID-19의 삼위일체: 면역, 염증, 중재 The trinity of COVID-19: immunity, inflammation and intervention https://www.nature.com/articles/s41577-020-0311-8 Fig. 1: Chronology of events during SARS-CoV-2 infection.
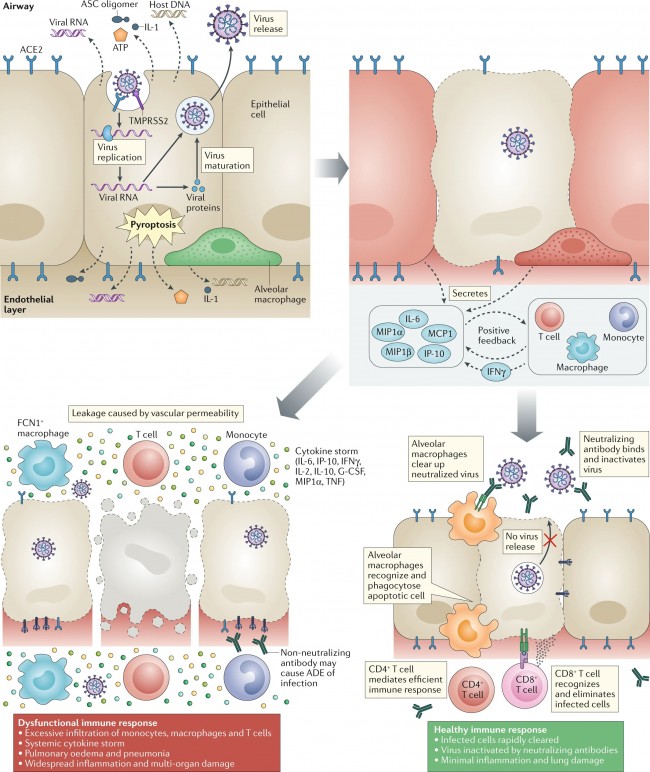
When severe acute respiratory syndrome coronavirus 2 (SARS-CoV-2) infects cells expressing the surface receptors angiotensin-converting enzyme 2 (ACE2) and TMPRSS2, the active replication and release of the virus cause the host cell to undergo pyroptosis and release damage-associated molecular patterns, including ATP, nucleic acids and ASC oligomers. These are recognized by neighbouring epithelial cells, endothelial cells and alveolar macrophages, triggering the generation of pro-inflammatory cytokines and chemokines (including IL-6, IP-10, macrophage inflammatory protein 1α (MIP1α), MIP1β and MCP1). These proteins attract monocytes, macrophages and T cells to the site of infection, promoting further inflammation (with the addition of IFNγ produced by T cells) and establishing a pro-inflammatory feedback loop. In a defective immune response (left side) this may lead to further accumulation of immune cells in the lungs, causing overproduction of pro-inflammatory cytokines, which eventually damages the lung infrastructure. The resulting cytokine storm circulates to other organs, leading to multi-organ damage. In addition, non-neutralizing antibodies produced by B cells may enhance SARS-CoV-2 infection through antibody-dependent enhancement (ADE), further exacerbating organ damage. Alternatively, in a healthy immune response (right side), the initial inflammation attracts virus-specific T cells to the site of infection, where they can eliminate the infected cells before the virus spreads. Neutralizing antibodies in these individuals can block viral infection, and alveolar macrophages recognize neutralized viruses and apoptotic cells and clear them by phagocytosis. Altogether, these processes lead to clearance of the virus and minimal lung damage, resulting in recovery. G-CSF, granulocyte colony-stimulating factor; TNF, tumour necrosis factor. Fig. 2: The structure of the trimeric spike protein of SARS-CoV-2.
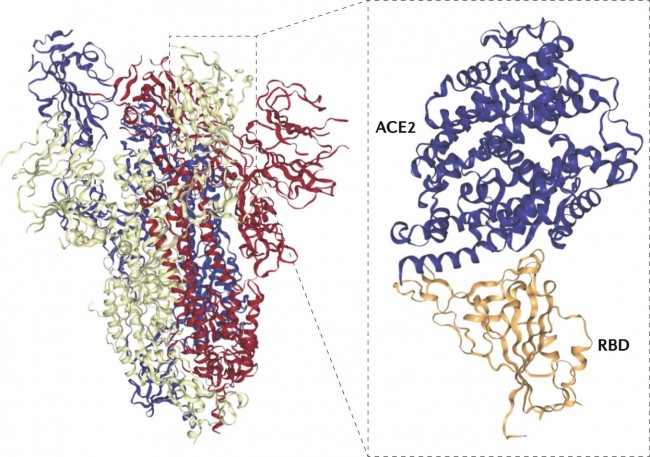
The receptor-binding domain (RBD) is shown interacting with its receptor, human angiotensin-converting enzyme 2 (ACE2). SARS-CoV-2, severe acute respiratory syndrome coronavirus 2. Adapted from Protein Data Bank IDs 6VSB42 and 6VW1 (ref.150). Fig. 3: Potential therapeutic approaches against SARS-CoV-2.
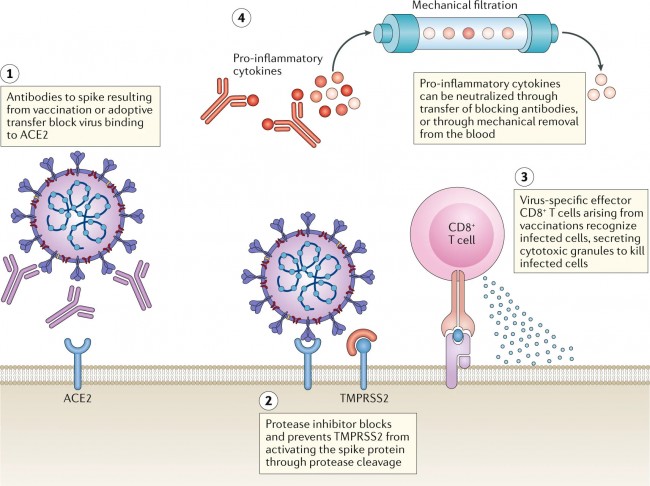
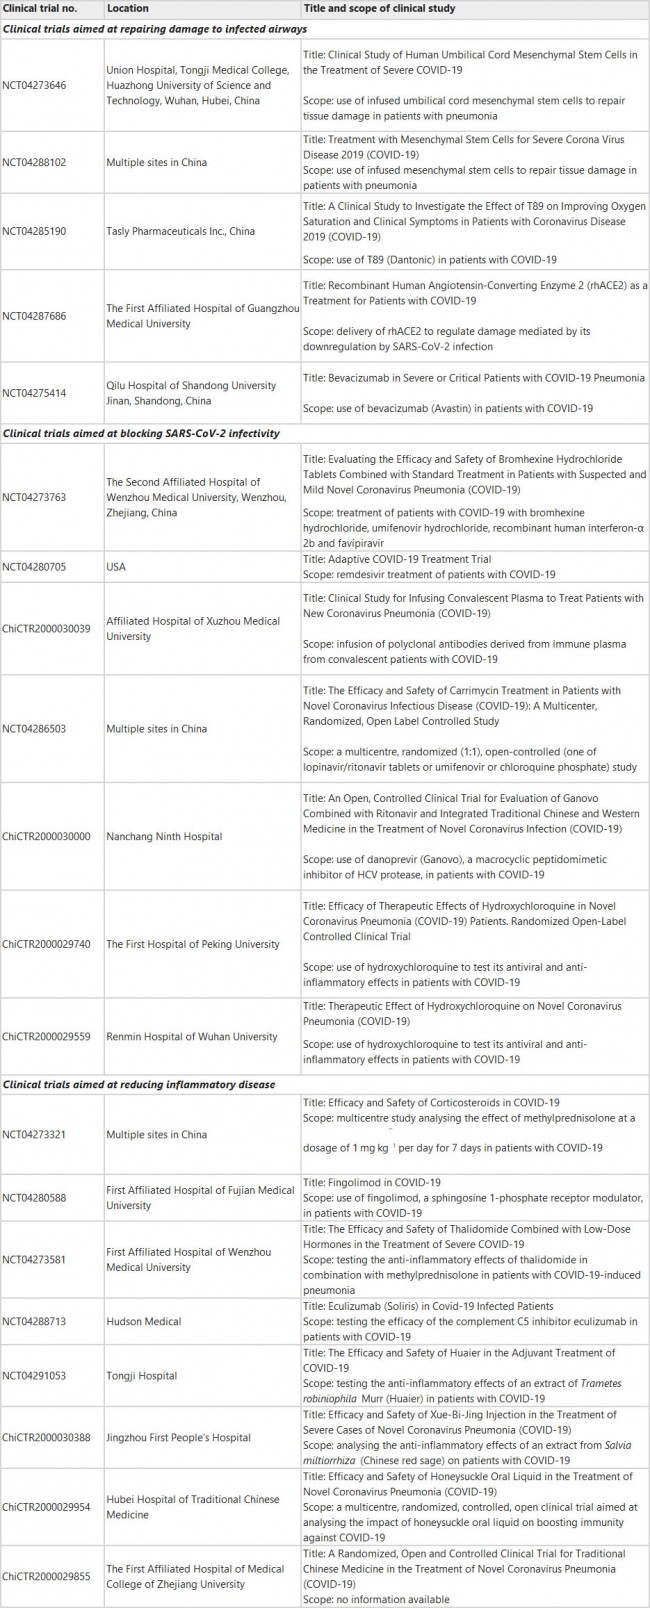
(1) Antibodies against the spike protein (raised through vaccination or by adoptive transfer) could block severe acute respiratory syndrome coronavirus 2 (SARS-CoV-2) from interacting with the angiotensin-converting enzyme 2 (ACE2) receptor on host cells. (2) Protease inhibitors against the serine protease TMPRSS2 can prevent spike protein cleavage, which is necessary for viral fusion into the host cell. Blocking either ACE2 interaction or viral fusion could prevent the virus from infecting the host cell. (3) Virus-specific memory CD8+ T cells from a previous vaccination or infection can differentiate into effector cells during rechallenge. When they identify infected cells presenting virus-specific epitopes, they degranulate and kill infected cells before they can produce mature virions. (4) In a novel treatment method that targets the cytokine storm symptoms, the blood of patients with coronavirus disease 2019 (COVID-19) can be passed through customized columns that are specially designed to trap pro-inflammatory cytokines, before the purified blood is passed back into patients. Table 1 Summary of approved interventional clinical trials for COVID-19 as of March 2020
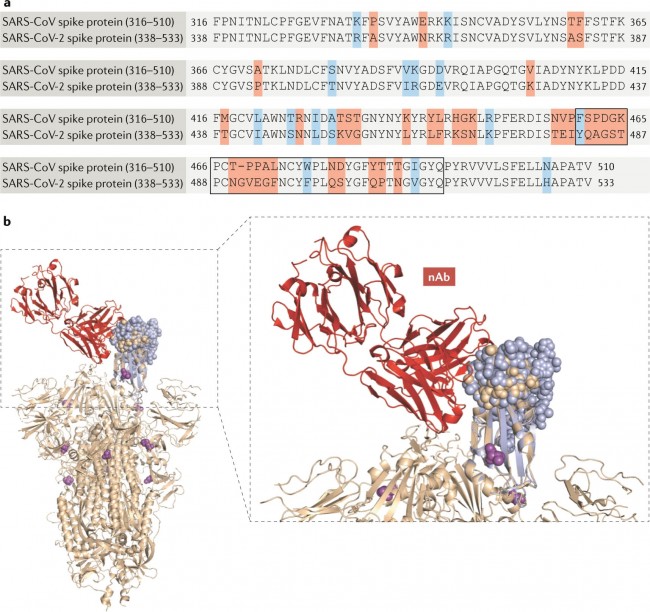
Data from ClinicalTrials.gov149. COVID-19, coronavirus disease 2019; HCV, hepatitis C virus; rhACE2, recombinant human angiotensin-converting enzyme 2; SARS-CoV-2, severe acute respiratory syndrome coronavirus 2. Fig. 4: Sequence alignment and structural comparison of SARS-CoV and SARS-CoV-2 spike proteins.
a | Sequence alignment of severe acute respiratory syndrome coronavirus (SARS-CoV) spike protein and severe acute respiratory syndrome coronavirus 2 (SARS-CoV-2) spike protein, with conserved amino acid residues shown in black and non-conserved residues shown in colours. b | The 3D structure of SARS-CoV-2 (Protein Data Bank ID 6VSB42, peach ribbon) is superimposed on the SARS-CoV receptor-binding motif (RBM) complex with the neutralizing antibody (nAb; red ribbon) interfacing with the RBM (Protein Data Bank 2DD8 (ref.151), purple ribbon). Peach and purple spheres denote the RBMs of SARS-CoV-2 and SARS-CoV, respectively. Magenta spheres denote non-synonymous alterations in the SARS-CoV-2 spike protein that have been reported135. Research Highlights | 28 April 2020 코로나19 병인의 이해를 위해 COVID-19: towards understanding of pathogenesis https://www.nature.com/articles/s41422-020-0327-4 Fig. 1: Hypothetical pathogenesis of COVID-19.
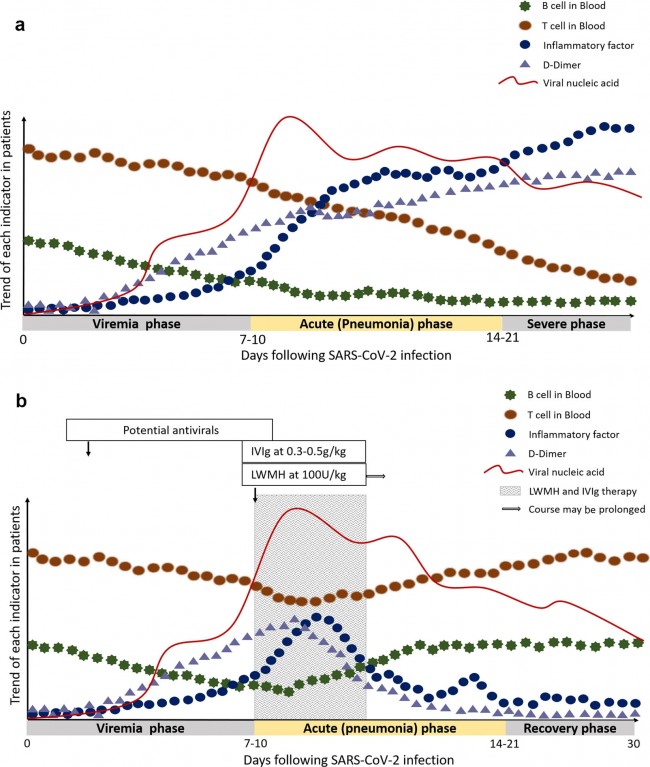
The X-axis refers to days after SARS-CoV-2 infection. The disease course is divided into three phases. The Y-axis shows the trend of T cells, B cells, inflammatory factors, D-dimer and viral load in patients. a The trend of each indicator in severe COVID-19 patients. b The trend of each indicator in severe COVID-19 patients after low-molecular-weight heparin (LWMH) and high-dose intravenous immunoglobulin (IVIg) therapy. The shaded areas represent the recommended intervention time for LMWH and IVIg treatment. Correspondence | 28 April 2020 코로나19 질환에서 첫 번째 증상으로 결막염이 나타난다고 제시 Coronavirus disease 2019 presenting with conjunctivitis as the first symptom https://www.nature.com/articles/s41433-020-0909-x Comments and Opinion | 28 April 2020 COVID-19 백신 설계: 면역 강화의 야누스 얼굴 COVID-19 vaccine design: the Janus face of immune enhancement https://www.nature.com/articles/s41577-020-0323-4 28 April 2020 퇴원 준비 환자의 폐조직에서 잔류 SARS-CoV-2에 대한 병리학적 근거 Pathological evidence for residual SARS-CoV-2 in pulmonary tissues of a ready-for-discharge patient https://www.nature.com/articles/s41422-020-0318-5 Fig. 1: Pathological observation of the lung tissues.
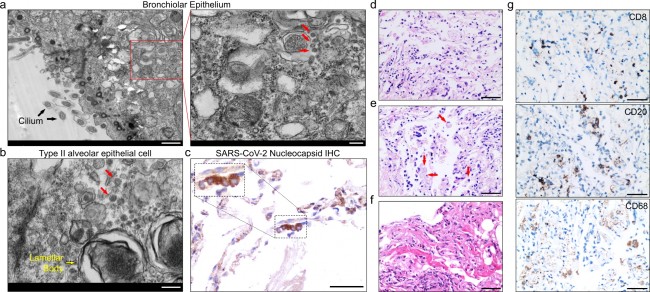
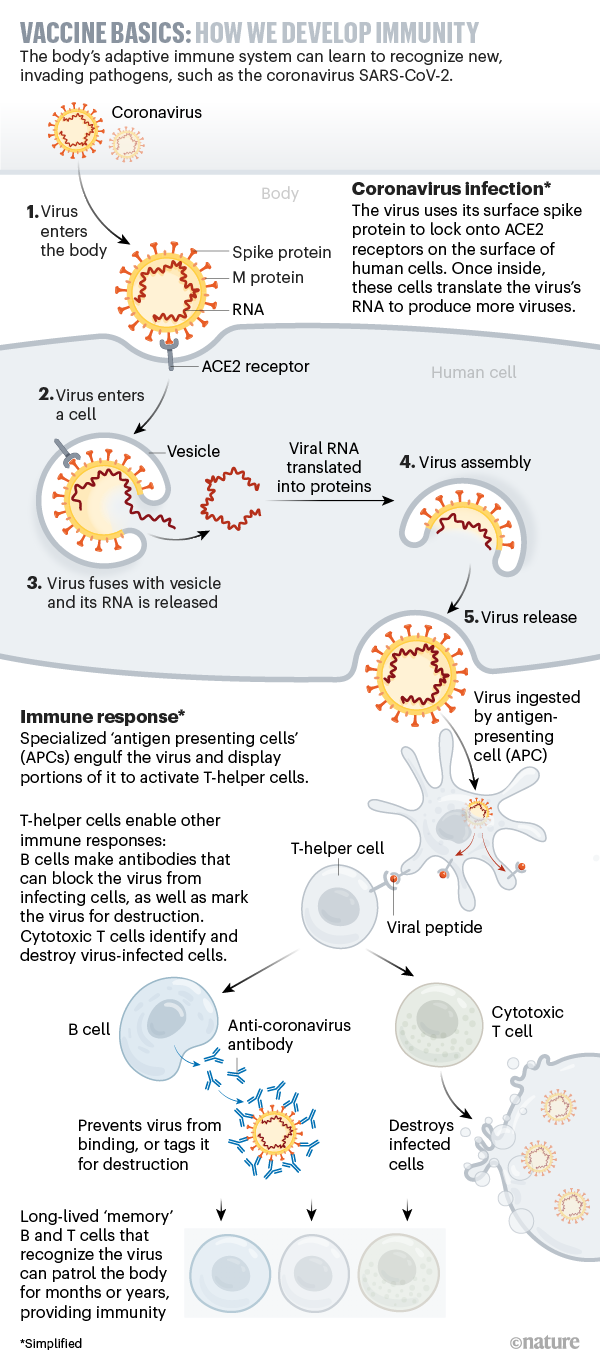
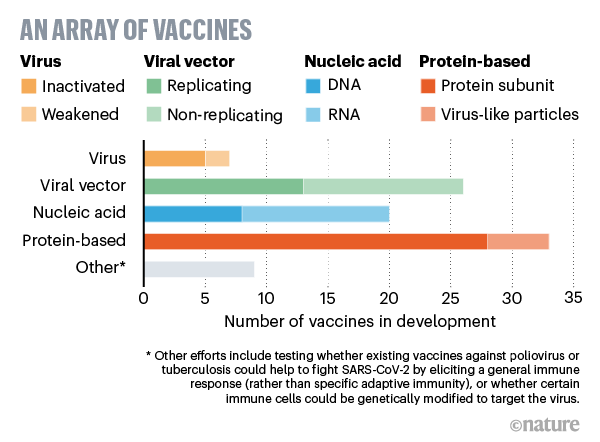
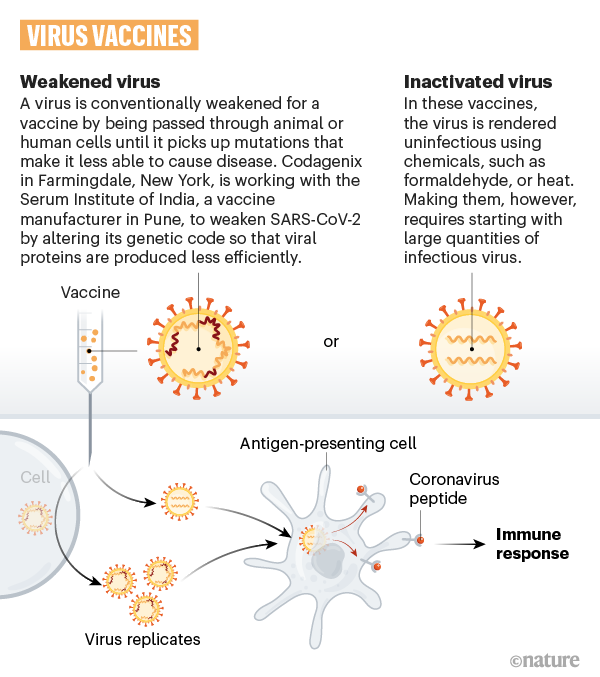
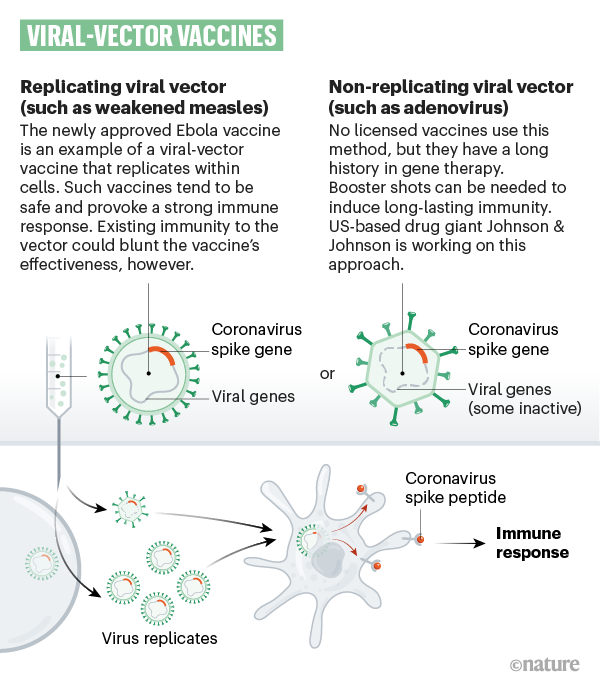
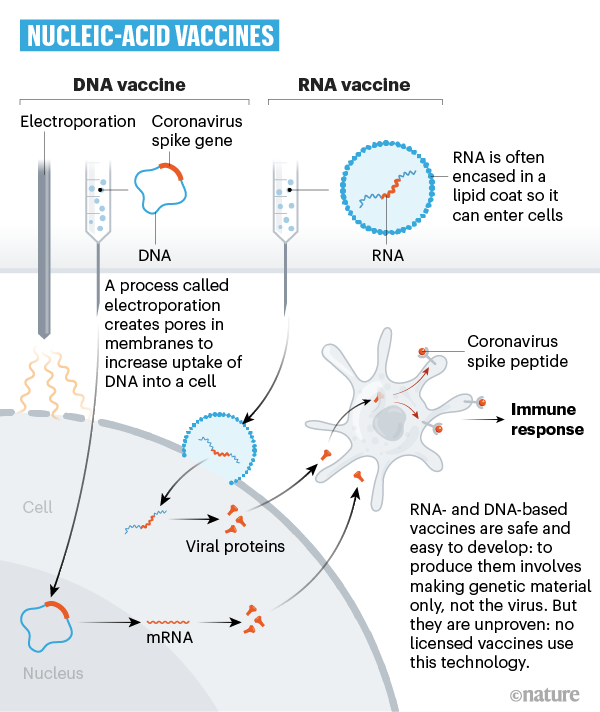
a) Electron microscopic examination on a single pulmonary bronchiolar epithelial cell. Black arrows in left panel indicate organelle in pulmonary epithelial cell. Red arrows in right panel label virus particles. Scale bar: 1 μm in left panel and 200 nm in right panel. b) Electron microscopic examination on a single type II alveolar epithelial cell. Yellow arrow indicates organelle in pulmonary epithelial cell. Red arrows label virus particles. Scale bar: 200 nm. c) Immunohistochemical (IHC) staining of SARS-CoV-2 nucleoprotein (N) in pulmonary tissue with monoclonal anti-nucleoprotein antibody. The inset represents magnification of the selected area. Dark brown signals indicate positive staining for SARS-CoV-2 nucleoprotein and nuclei are counterstained with hematoxylin. Scale bar: 50 μm. d) H&E staining shows desquamated and enlarged epithelial cells. Scale bar: 50 μm. e) H&E staining shows exudative monocytes/macrophages in alveoli. Red arrows show typical macrophages in alveoli. Scale bar: 50 μm. f) H&E staining shows formation of hyaline membranes. Scale bar: 50 μm. g) IHC staining indicates lung-infiltrated immune cells: CD68+ macrophages, CD20+ B cells, and CD8+ T cells. Scale bar: 50 μm. News | 28 April 2020 코로나바이러스 백신 경쟁: 그래픽 가이드 과학자들이 SARS-Cov-2에 면역력을 제공하기를 바라는 8가지 방법 The race for coronavirus vaccines: a graphical guide Eight ways in which scientists hope to provide immunity to SARS-CoV-2. https://www.nature.com/articles/d41586-020-01221-y 1) Vaccine basics: How we develop immunity – Coronavirus infection 2) Vaccine basics: How we develop immunity – Immune response
3) SARS-CoV-2 vaccines: a variety of approaches
4) Virus vaccines
5) Viral-vector vaccines
6) Nucleic-acid vaccines
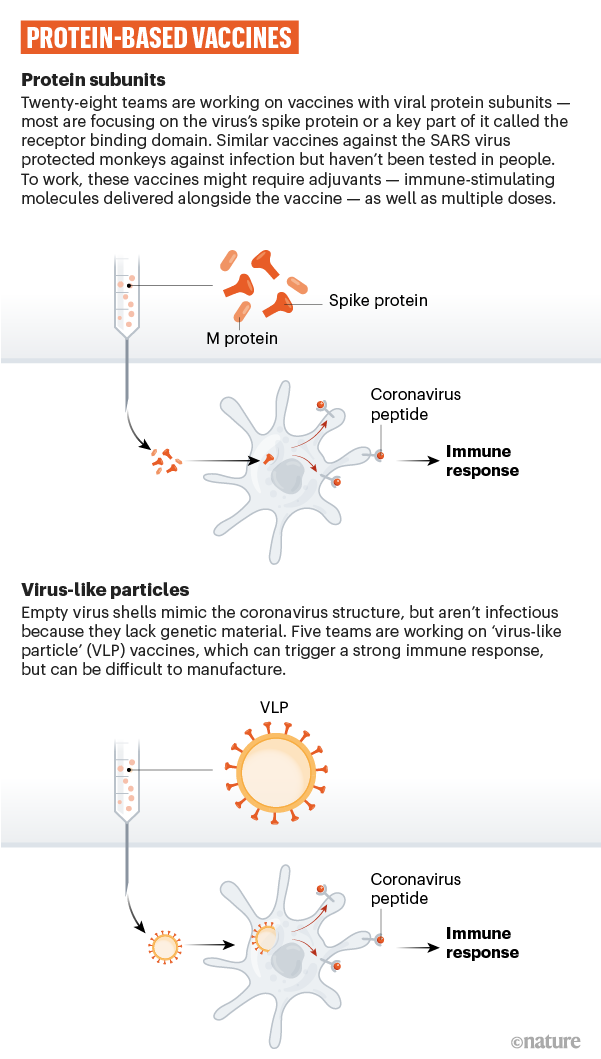
7) Protein-based vaccines
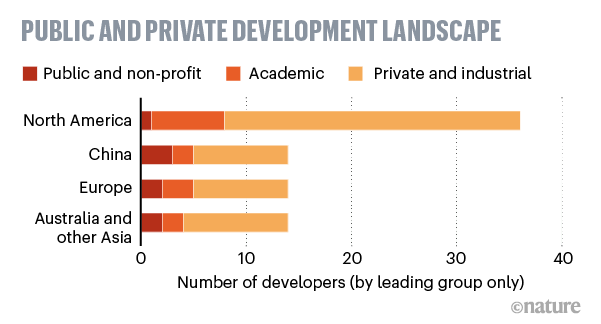
8) Industry trials
Research Highlights | 28 April 2020 경증 COVID-19에서의 중화 항체 반응 Neutralizing antibody response in mild COVID-19 https://www.nature.com/articles/s41577-020-0325-2 Research Highlights | 28 April 2020 COVID-19 백신을 알려주는 암 치료 도구 Cancer therapy tool informs COVID-19 vaccines https://www.nature.com/articles/s41577-020-0326-1 Reviews | 27 April 2020 코로나바이러스와 ACE2, 안지오텐신 II 및 RAS 억제제의 상호작용 - COVID-19에 대한 유용한 근거 및 통찰력으로부터 얻은 정보 Interactions of coronaviruses with ACE2, angiotensin II, and RAS inhibitors - lessons from available evidence and insights into COVID-19 https://www.nature.com/articles/s41440-020-0455-8 Fig. 1
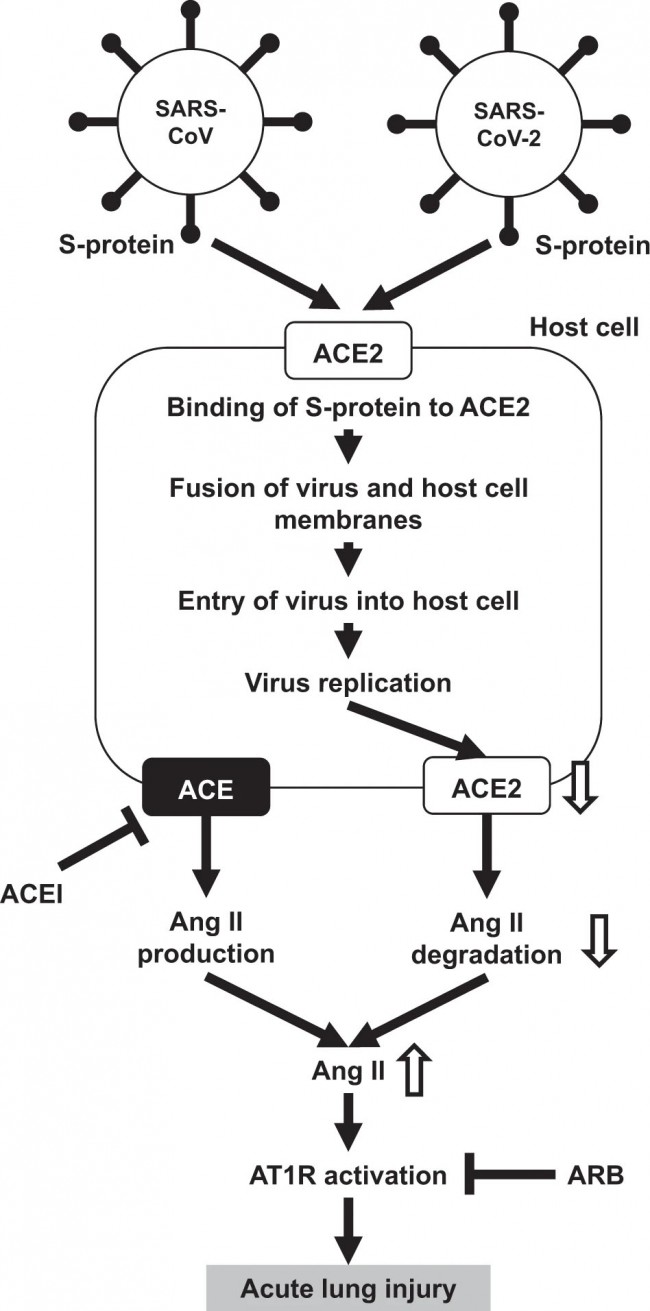
Possible scheme of the association of ACE2, angiotensin II, and AT1R and acute lung injury of SARS and COVID-19. Ang II, angiotensin II; ACE, angiotensin-converting enzyme; ACE2, angiotensin-converting enzyme 2; ACEI, angiotensin-converting enzyme inhibitor; AT1R, angiotensin II type-1 receptor; ARB, angiotensin II type-1 receptor blocker; SARS-CoV, severe acute respiratory syndrome coronavirus; SARS-CoV-2, severe acute respiratory syndrome coronavirus 2; S-protein, spike-glycoprotein Fig. 2
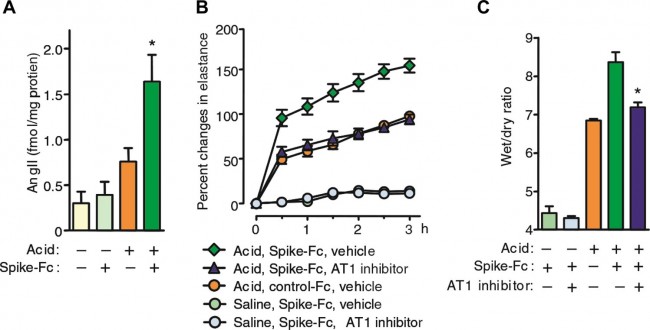
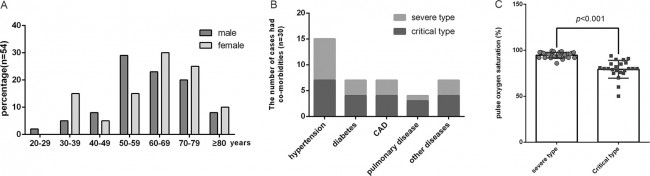
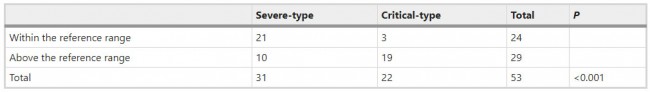
SARS-CoV spike mediates lung injury through modulation of angiotensin II in acid aspiration mice. a Lung angiotensin II levels in SARS-CoV-S protein (spike-Fc protein)- or control Fc protein-treated mice after acid or saline aspiration. *P < 0.05 vs. control-treated mice after acid aspiration. b Effects of losartan (15 mg/kg) (AT1 inhibitor) on lung elastance measurements in acid plus spike-Fc protein-treated mice (n = 4–6 per group). P < 0.05 comparing losartan-treated spike-Fc–challenged mice with vehicle-treated spike-Fc–challenged mice. c Effects of losartan (15 mg/kg) on lung edema (wet/dry weight ratio) in acid plus spike-Fc protein-treated mice (n = 4–6 per group). P < 0.05 vs. vehicle-treated wild-type mice after acid injury. AT1, angiotensin II type-1 receptor. Cited from ref. [27] Comments and Opinion | 27 April 2020 COVID-19로부터 보호하는 데 BCG를 사용할 수 있는가? Could BCG be used to protect against COVID-19? https://www.nature.com/articles/s41585-020-0325-9 Research | 27 April 2020 중증·중증형 2019 신종 코로나바이러스 폐렴 환자 54명을 대상으로 한 실험실 검사의 후향적 분석 Retrospective analysis of laboratory testing in 54 patients with severe- or critical-type 2019 novel coronavirus pneumonia https://www.nature.com/articles/s41374-020-0431-6 Fig. 1: General characteristics of patients.
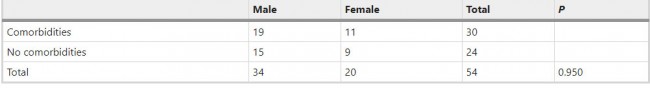
The ages of the patients (a), the distribution of comorbidities in patients (b). pulse oxygen saturation at the time of admission (c). CAD coronary artery heart disease; n = 54. Table 1 Gender differences in comorbidities.
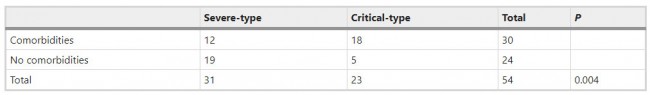
Table 2 Differences between severe-type and critical-type patients with comorbidities.
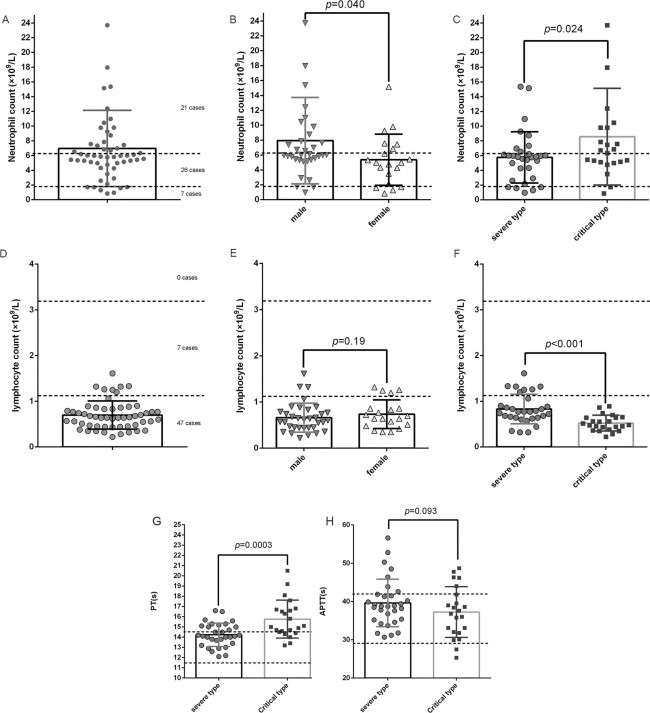
Fig. 2: Bloodwork and coagulation function testing.
Neutrophil counts in all patients (a); comparison of neutrophil counts in males and females (b); comparison of neutrophil counts in severe-type and critical-type patients (c); lymphocyte counts in all patients (d); comparison of lymphocyte counts in males and females (e); comparison of lymphocyte count in severe-type and critical-type patients (f); comparison of PT values of severe-type and critical-type patients (g); comparison of APTT values of severe-type and critical-type patients (h). PT prothrombin, APTT activated partial thromboplastin time; The two dotted lines are the upper and lower limits of the reference range. Table 3 Comparison of FDPs test between severe-type and critical-type patients.
Table 4 Comparison of D–D test between severe-type and critical-type patients.
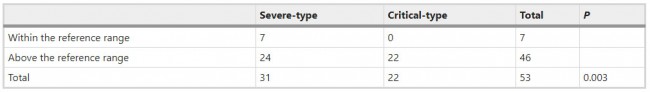
Fig. 3: Detection of serum ferritin.
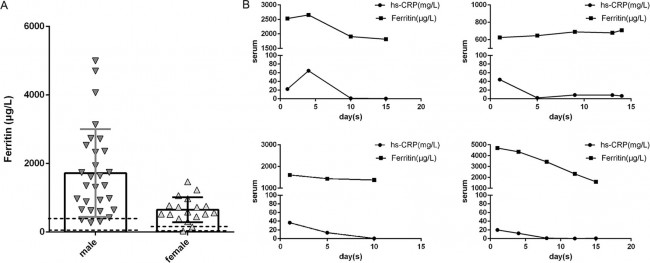
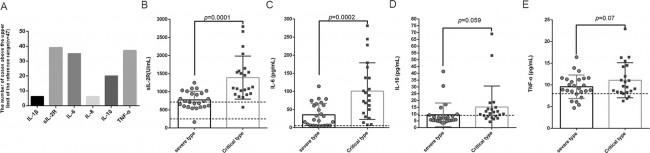
Serum ferritin measurement in all patients (a); duration of the increase in ferritin and hs-CRP (b). hs-CRP hypersensitive c-reactive protein. The two dotted are the upper and lower limits of the reference range. Fig. 4: The detection of inflammatory factors.
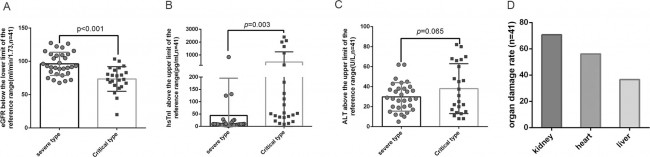
Frequency of inflammatory factor levels above the upper limit of the reference range (a); sIL-2R level in severe and critical-type patients (b); IL-6 level in severe and critical-type patients (c); IL-10 levels in severe and critical-type patients (d); TNF-α concentrations in severe and critical-type patients (e). sIL-2R: soluble IL-2 receptor; (n = 47). The two dotted lines are the upper and lower limits of the reference range for detection, The single dotted line is the upper limit of the reference range. Fig. 5: Blood biochemistry.
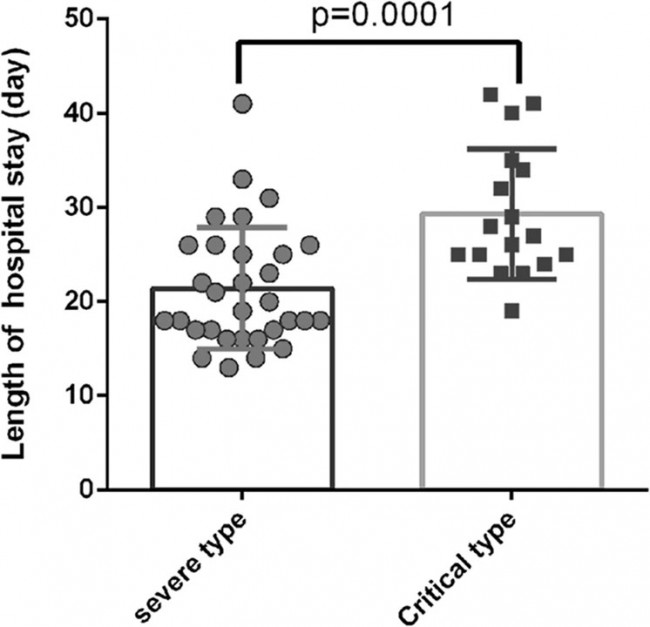
Comparison of the estimated glomerular filtration rate (eGFR) in severe-type and critical-type patients (a), Comparison of high sensitivity Troponin hsTnI (b), and alanine aminotransferase ALT (c) between severe and critical-type patients, Histogram of the number of cases of organ injury (d). (n = 41). Fig. 6: The lengths of hospital stays.
The lengths of hospital stays for severe and critical-type patients (n = 48). Comments and Opinion | 27 April 2020 항체 검사는 COVID-19 예방 시험의 성능과 정확성을 향상시킬 것이다. Antibody testing will enhance the power and accuracy of COVID-19-prevention trials. https://www.nature.com/articles/s41591-020-0887-3 Research | 27 April 2020 우한 병원 2곳에서 SARS-CoV-2의 공기역학적 분석 Aerodynamic analysis of SARS-CoV-2 in two Wuhan hospitals https://www.nature.com/articles/s41586-020-2271-3 Comments and Opinion | 27 April 2020 RNA 치료제 증가 중 RNA therapeutics on the rise https://www.nature.com/articles/d41573-020-00078-0
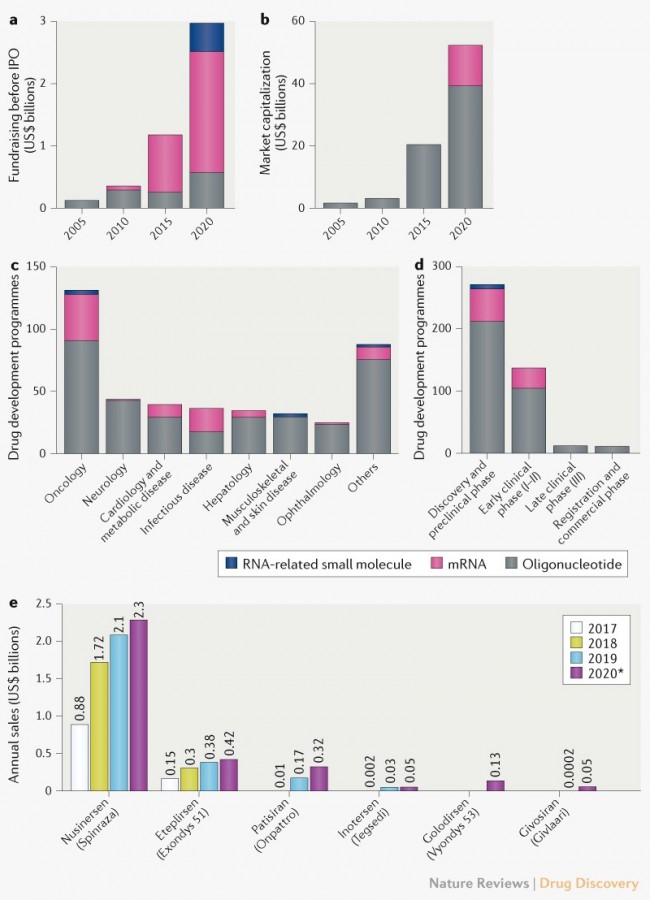
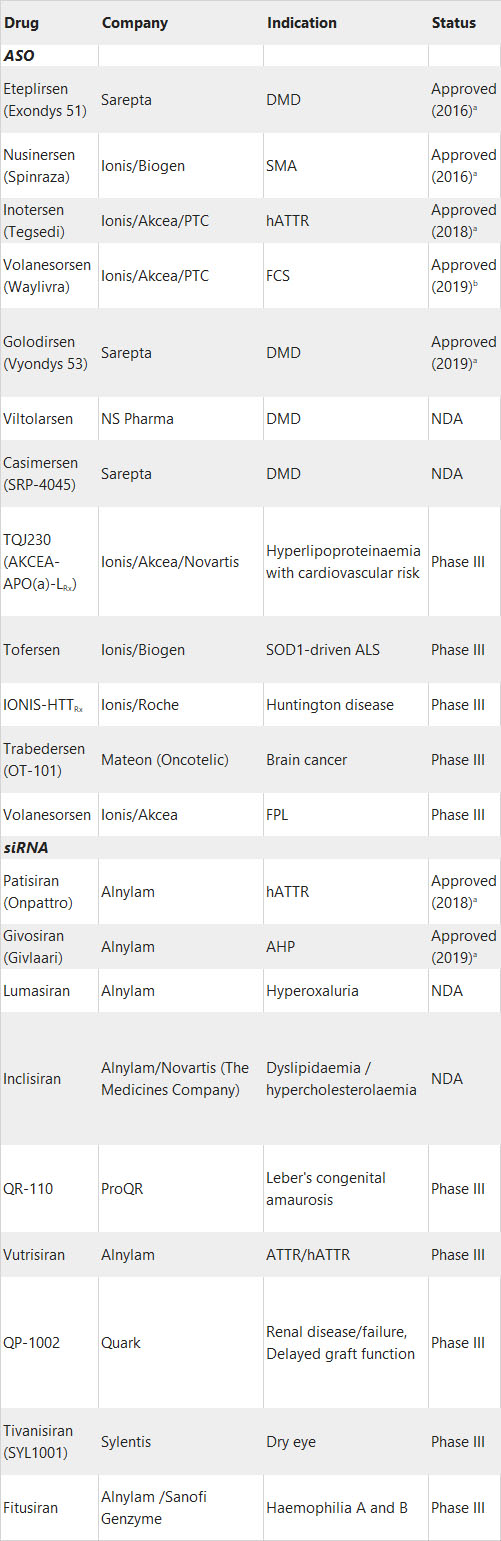
Fig. 1 | Financial data and pipeline characteristics for RNA therapeutics. a | Fundraising of private RNA therapeutics companies. Source: CrunchBase. b | Market capitalization of public RNA therapeutics companies. Source: Y-Charts. c | Targeted diseases by RNA therapeutics. d | Development stages of RNA therapeutics. Source: Biomedtracker, Informa, June 2019; updated January 2020. e | Revenue from approved RNA therapeutics. *Projected revenues for 2020. Source: companies’ Form 10-K and Datamonitor Healthcare, Informa, January 2020. TABLE 1 | SELECTED RNA THERAPEUTICS APPROVED AND IN DEVELOPMENT
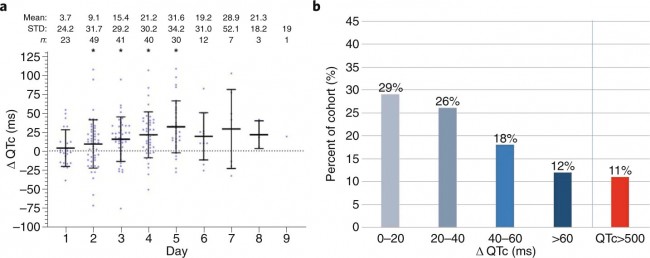
AHP, acute hepatic porphyria; ALS, amyotrophic lateral sclerosis; ASO, antisense oligonucleotide; DMD, Duchenne muscular dystrophy; FCS, familial chylomicronaemia syndrome; FPL, familial partial lipodystrophy; hATTR, hereditary transthyretin amyloidosis; NDA, new drug application; SMA, spinal muscular atrophy. aThis refers to approval in the USA by the FDA, which was the first major market approval for all agents. bVolanesorsen (Waylivra) is approved in the EU, but is still at NDA stage in the USA. Source: Biomedtracker, Informa, June 2019; updated January 2020. Correspondence | 24 April 2020 하이드록시클로로킨과 아지트로마이신을 사용한 COVID-19 환자의 QT 간격 The QT interval in patients with COVID-19 treated with hydroxychloroquine and azithromycin https://www.nature.com/articles/s41591-020-0888-2 Fig. 1: Changes in QTc on HY/AZ therapy.
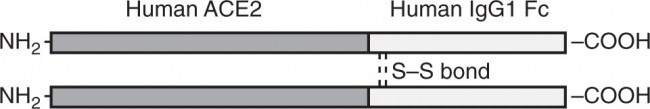
a, Change in QTc, presented as days after HY/AZ initiation. *P < 0.01, QTc compared with baseline QTc (one-sample t-test to compare each sample against a change in QTc (ΔQTc) of 0 ms (i.e., no change from baseline), with adjustment for multiple testing). Each data point represents a single patient with a single ECG at any given interval (n). STD, standard deviation. b, Frequency of patients with various ranges of QTc prolongation (horizontal axis). Five cardiologists trained and experienced in QT measurement performed all ECG measurements. QT and RR measurements were validated by a senior cardiac electrophysiologist expert in QT measurements. QTc was corrected with the Bazett formula (QTc = QT/RR1/2). Research | 24 April 2020 | OPEN 재조합 ACE2 면역 글로불린 (ACE2-Ig)이 SARS-CoV-2 스파이크 유사형 바이러스 감염을 효과적으로 중화 Neutralization of SARS-CoV-2 spike pseudotyped virus by recombinant ACE2-Ig https://www.nature.com/articles/s41467-020-16048-4 Fig. 1: Schematic of ACE2-Ig.
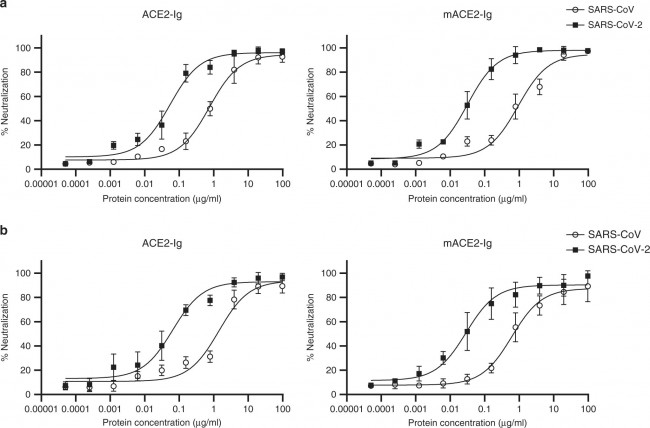
The recombinant ACE2-Ig fusion protein exists as a homodimer with each subunit consisting of a ACE2 peptidase domain linked to an Fc domain of human IgG. Fig. 2: ACE2-Ig potently neutralizes viruses pseudotyped with the S glycoproteins.
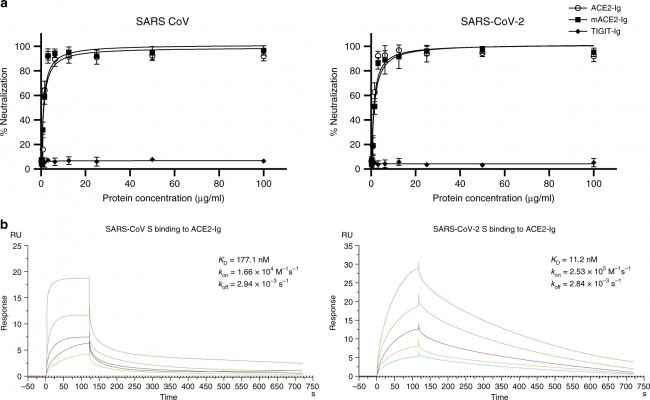
HIVs pseudotyped with the S glycoproteins from CoVs were incubated with different fusion proteins for 1 h before infection. Luciferase activities in target 293 T cells (a) and A549 cells (b) were measured, and the percent neutralization was calculated. Data are the means ± s.d. of four independent biological replicates. Source data (a, b) are provided as a Source Data file. Fig. 3: Inhibition of cell fusion by ACE2-Ig.
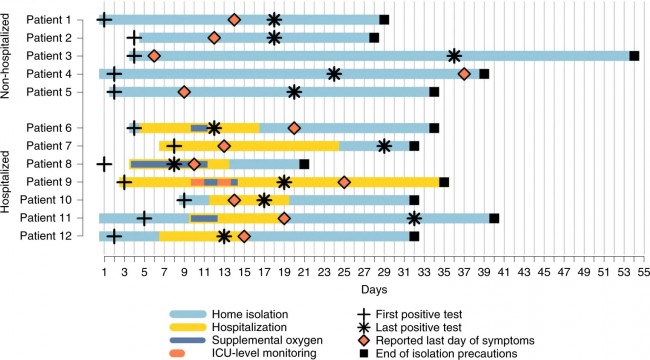
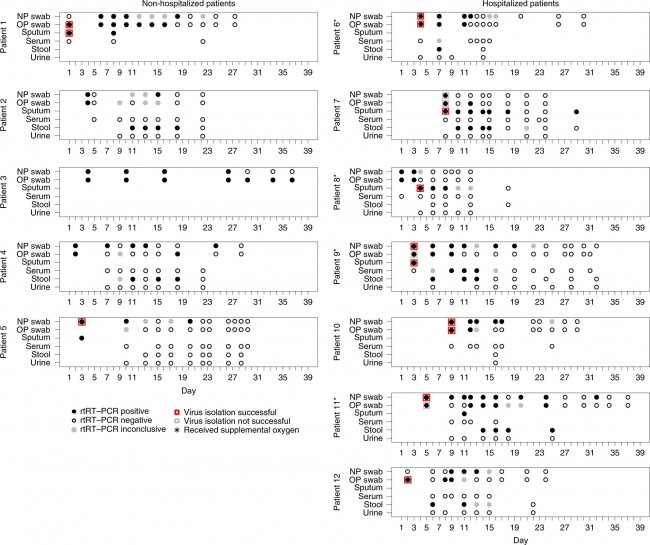
a Potent inhibition of cell fusion was mediated by the SARS-CoV (left) or SARS-CoV-2 (right) S glycoproteins. Cells expressing different S glycoproteins were incubated with the indicated fusion protein and mixed with ACE2-expressing cells. The activity of the reporter gene, β-gal, was measured as a correlate of fusion. The curves represent the best fit to the experimental data, and were used to calculate IC50 values. b Kinetic analysis of SARS-CoV S protein and SARS-CoV-2 S protein binding to ACE2-Ig was performed by surface plasmon resonance (SPR). Data are the means ± s.d. of four (a) independent biological replicates. Results shown represent three (b) independent experiments. Source data (a) are provided as a Source Data file. Correspondence | 24 April 2020 메커니즘: 안지오텐신-수용체 차단제가 ACE2 수준을 증가 Mechanisms by which angiotensin-receptor blockers increase ACE2 levels https://www.nature.com/articles/s41569-020-0387-7 Research Highlights | 24 April 2020 용해성 사람 ACE2는 신장 오가노이드의 SARS-CoV-2 감염을 예방한다. SARS-CoV-2 infection of kidney organoids prevented with soluble human ACE2 * 참고: 줄기세포를 분화시켜 만든 미니 장기인 오가노이드는 이식 목적으로는 적합하지 않은 작고 원시적인 구조를 지니고 있으나 여러 가지 기초 연구 및 약물 테스트를 하는 데는 적합한 특징을 지니고 있다. 실제 사람을 대상으로 하는 위험을 피하면서 여러 가지 위험한 연구를 진행할 수 있고, 동물 모델에서는 반영할 수 없는 사람만의 특이적인 구조와 기능을 그대로 유지할 수 있기 때문이다. 물론 오가노이드가 동물 모델이나 임상 시험을 완전히 대신하진 못하지만, 과학자들에게 중요한 추가 옵션을 제공하고 있다. https://www.nature.com/articles/s41581-020-0291-8 Research | 23 April 2020 미국 COVID-19 환자 12명의 임상 특징 및 바이러스 특성 Clinical and virologic characteristics of the first 12 patients with coronavirus disease 2019 (COVID-19) in the United States https://www.nature.com/articles/s41591-020-0877-5 Fig. 1: Timeline of illness onset, SARS-CoV-2 RNA detection, hospitalization, oxygen requirement and reported symptom resolution among the first 12 patients with COVID-19 in the United States, January to February 2020.
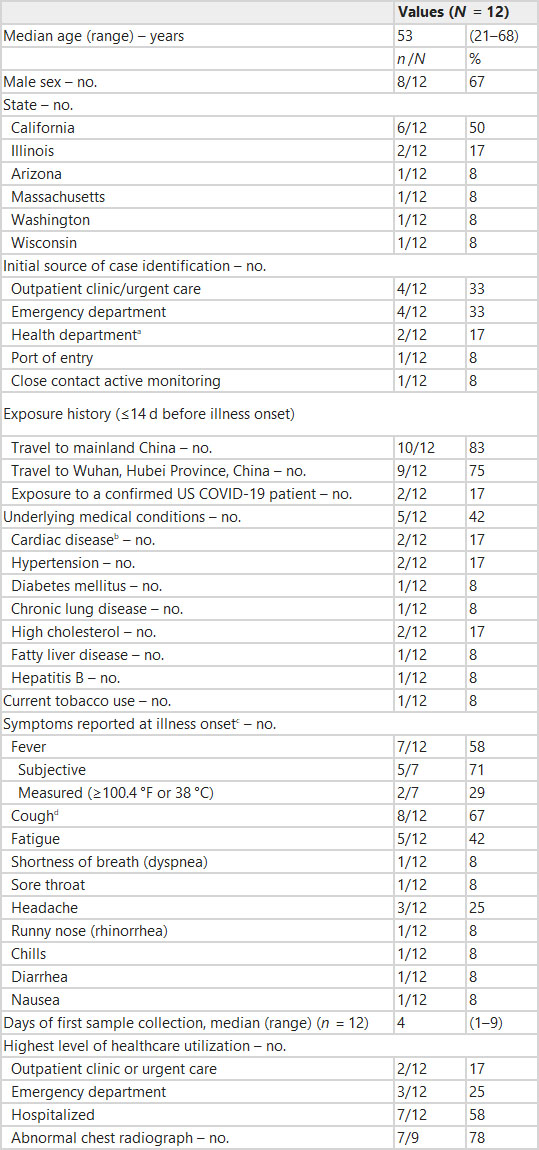
Patients 1–5 were not hospitalized and patients 6–12 were hospitalized. Days are sequential from day of symptom onset (day 1). Light blue bars indicate time patients were under home isolation. Yellow bars indicate duration of hospitalization. Dark blue bars indicate duration of supplemental oxygen administration in hospital. The orange dashed bar indicates duration of intensive care unit (ICU)-level monitoring for patient 9. The black ‘+’ indicates collection date of the earliest sample that tested positive for SARS-CoV-2 by rRT–PCR. The black asterisk indicates collection date of the latest sample tested by CDC with a positive result for SARS-CoV-2 by rRT–PCR. The orange diamond indicates date of last report of symptoms. The black square indicates the last day of isolation precautions. Patient 9 was isolated in a healthcare facility for the full time period; they were discharged from the first healthcare facility on day 27 and subsequently transferred to a second healthcare facility for public health purposes. Patient 1 reported a cough with initial onset in mid-December before the patient traveled to China. The patient reported no change in the cough from the initial onset until reported resolution on day 14. Because onset date was difficult to determine for this patient, we have used date of detection as day 1 to assess viral RNA detection. Table 1 Demographic characteristics, exposure history and clinical characteristics of the first 12 patients with COVID-19 in the United States, January to February 2020
a) Includes one person who was a contact of a confirmed COVID-19 patient. b) Includes coronary artery disease and pacemaker for bradycardia. Reports of hypertension were not included. c) Initial symptoms were obtained through patient interview and may have differed from symptoms at the time of identification. d) One patient reported a cough with initial onset in mid-December before the patient traveled to China. The patient reported no change in the cough from the initial onset until resolution 2 weeks after SARS-CoV-2 was first detected. Fig. 2: Clinical and laboratory values by illness day for the first seven patients hospitalized with COVID-19 in the United States, January to February 2020.
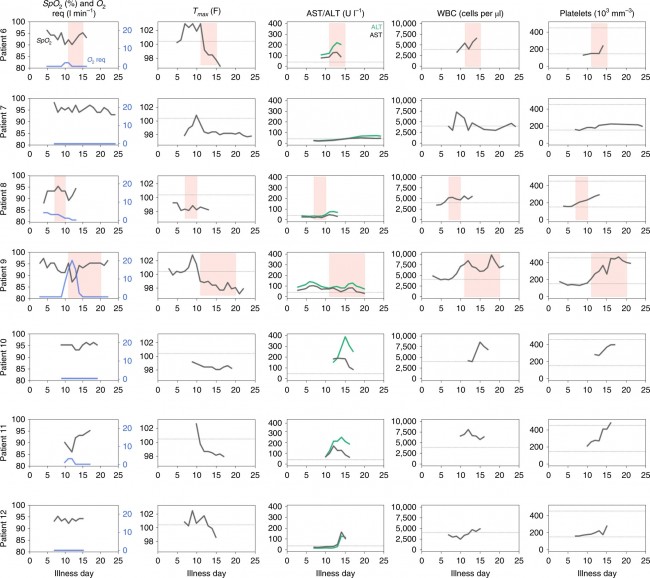
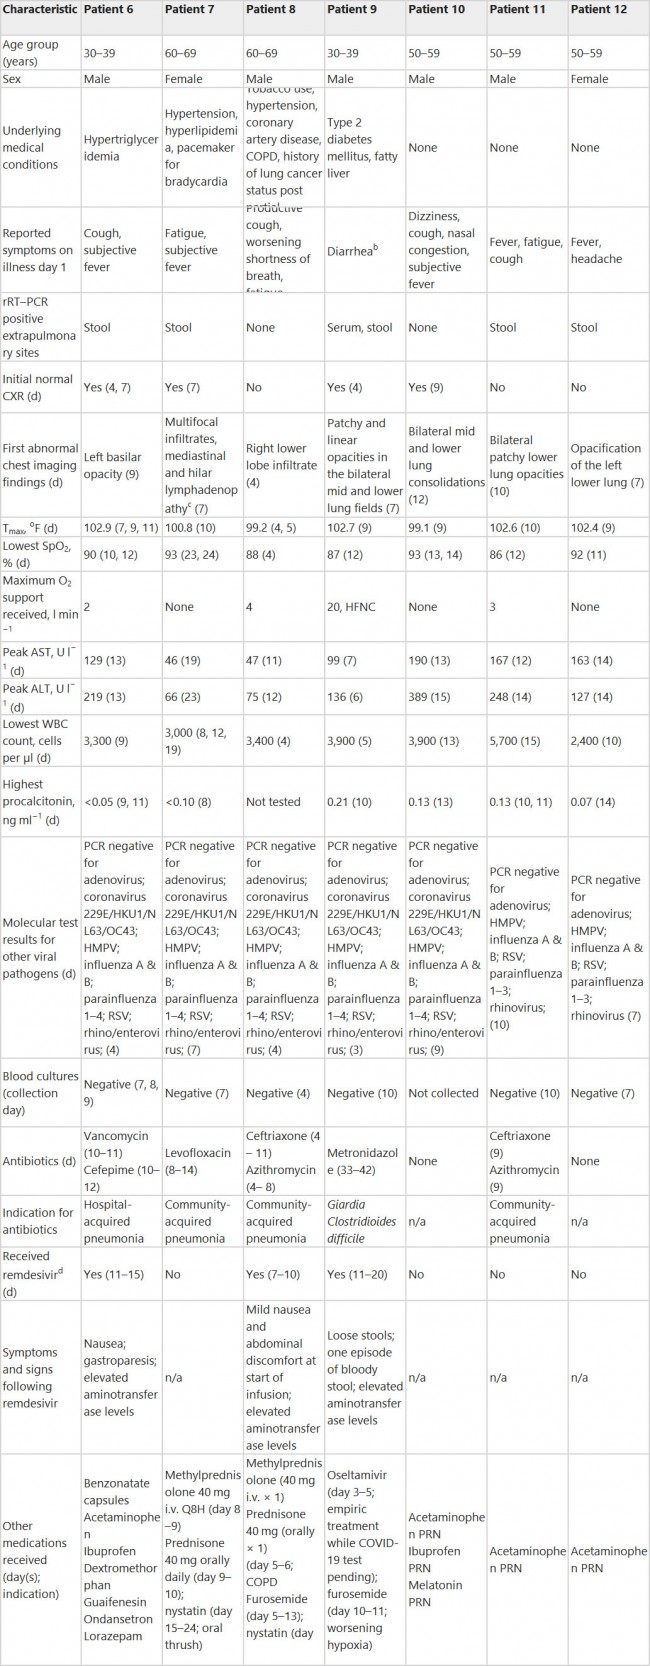
Clinical and laboratory values collected during hospitalization are shown for seven hospitalized patients by illness day. Values include oxygen saturation (SpO2), supplemental oxygen requirement (O2 req), maximum body temperature (Tmax), AST, ALT and white blood cell (WBC) count. Pink shading indicates days of remdesivir administration for three patients. Dotted lines show fever threshold of 100.4 °F (Tmax), 40 U l−1 for AST and ALT, 4,000 cells per µl for WBC and 150 and 250 103 mm−3 for platelets. Table 2 Clinical characteristics of the first seven patients hospitalized with COVID-19 in the United States, January to February 2020a
n/a, not applicable; COPD, chronic obstructive pulmonary disease; CXR, chest radiograph; HFNC, high-flow nasal cannula; HMPV, human metapneumovirus; i.v., intravenously; PRN, as needed; Q8H, every 8 h; RSV, respiratory syncytial virus. a) All reported days are illness day. b) Patient 9 reported diarrhea 1 d before development of fever and cough. c) Chest computed tomography scan; findings for other patients are reported from chest radiographs. d) Remdesivir dose: 200 mg i.v. once on day 1, then 100 mg i.v. daily. Fig. 3: SARS-CoV-2 rRT–PCR results by specimen type and day among the first 12 patients with COVID-19 in the United States, January to February 2020.
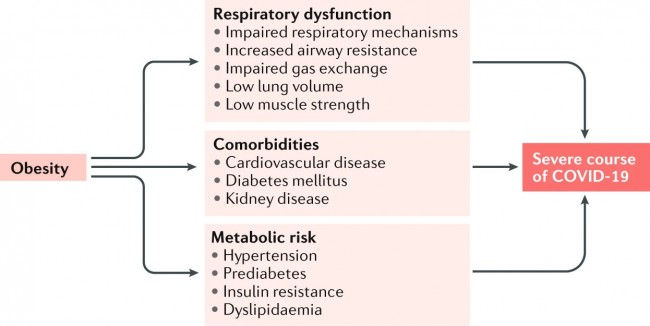
Specimen types tested include NP swab, OP swab, sputum, serum, stool and urine. Days are sequential from day of symptom onset (day 1). Viral culture was attempted on selected respiratory specimens collected early in the course of illness. rRT–PCR results were reported as positive (all three targets positive), negative (all three targets negative) or inconclusive (only one or two positive targets). Black-filled circles indicate rRT–PCR-positive specimens. Black-outlined circles indicate rRT–PCR-negative specimens. Gray-filled circles indicate specimens with inconclusive rRT–PCR results. Red squares surrounding black-filled circles indicate rRT–PCR-positive specimens from which viral culture was successful. Gray squares surrounding black-filled circles indicate rRT–PCR-positive specimens from which viral culture was unsuccessful. An asterisk indicates patients who required supplemental oxygen. Comments and Opinion | 23 April 2020 COVID-19 환자의 비만 및 대사 건강 손상 Obesity and impaired metabolic health in patients with COVID-19 https://www.nature.com/articles/s41574-020-0364-6 Fig. 1: Obesity-related comorbidities and mechanisms of a severe course of COVID-19.
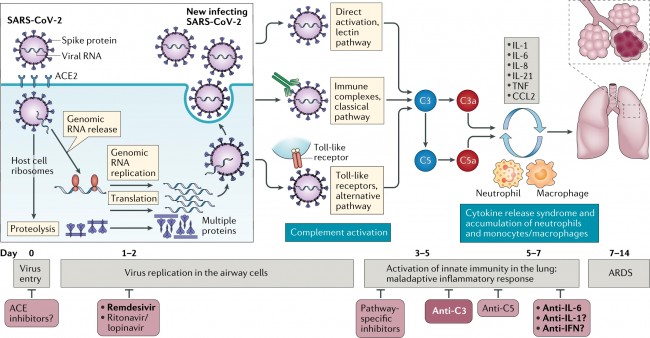
Patients with obesity often have respiratory dysfunction, which is characterized by alterations in respiratory mechanisms, increased airway resistance, impaired gas exchange and low lung volume and muscle strength. These individuals are predisposed to hypoventilation-associated pneumonia, pulmonary hypertension and cardiac stress. Obesity is also associated with an increased risk of diabetes mellitus, cardiovascular disease and kidney disease, comorbidities that are considered to result in increased vulnerability to pneumonia-associated organ failures. However, even in the absence of comorbidities of obesity, the presence of hypertension, dyslipidaemia, prediabetes and insulin resistance might predispose individuals to cardiovascular events and increased susceptibility to infection via atherosclerosis, cardiac dysfunction and impaired immune response. Comments and Opinion | 23 April 2020 COVID-19 타겟으로 보체 활성화? COVID-19의 효과적인 치료법을 긴급하게 개발할 필요가 있다. 현재 우리는 면역학자와 임상의들에서 코로나19 환자들의 보체 활성화 시스템을 타겟으로 하는 잠재력을 고려할 것을 촉구한다. Complement as a target in COVID-19? There is an urgent need to develop effective therapies for COVID-19. Here, we urge immunologists and clinicians to consider the potential of targeting the complement system in these patients. https://www.nature.com/articles/s41577-020-0320-7
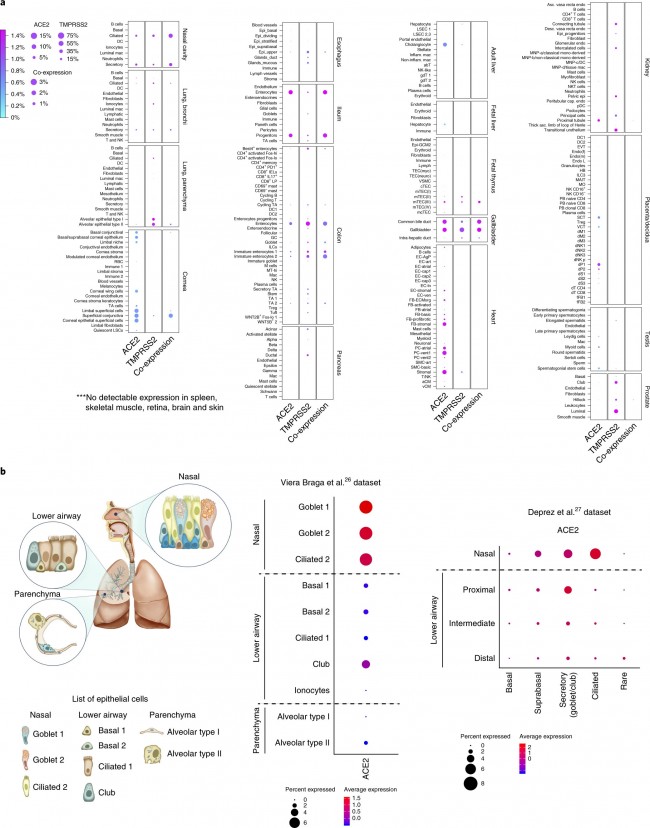
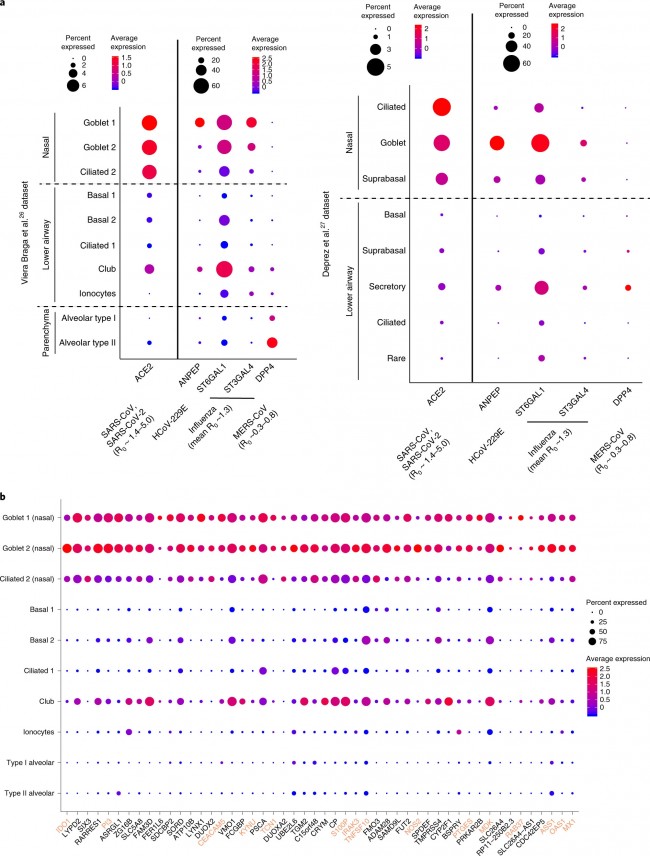
Research | 23 April 2020 SARS -CoV-2 진입 인자는 선천 면역 유전자와 함께 코 상피 세포에서 높게 발현된다. SARS-CoV-2 entry factors are highly expressed in nasal epithelial cells together with innate immune genes https://www.nature.com/articles/s41591-020-0868-6 Fig. 1: Expression of ACE2 and TMPRSS2 across different tissues and its enrichment in nasal epithelial cells.
a, RNA expression of SARS-CoV-2 entry receptor ACE2 (first column), entry-associated protease TMPRSS2 (second column) and their co-expression (third column) from multiple scRNA-seq datasets across different tissues. DC, dendritic cells; mac, macrophages, RBC, red blood cells; TA, transit-amplifying cells; LSC, limbal stem cells; Epi, epithelial cells; IEL, intraepithelial lymphocytes; ILC, innate lymphoid cells; GC, germinal center B cells; MT, mitochondria; LSEC, liver sinusoidal endothelial cells; VSMC, vesicular smooth muscle cells; cTEC, cortical thymic epithelial cells; mTEC, medullary thymic epithelial cells; mcTEC, medullary/cortical thymic epithelial cells; EC, endothelial cells; FB, fibroblasts; SMC, smooth muscle cells; aCM, atrial cardiomyocytes; vCM, ventricular cardiomyocytes; MNP, mononuclear phagocytes; EVT, extravillous trophoblast cells; HB, Hofbauer cells; MAIT, mucosal-associated invariant T cells; MO, monocytes; SCT, syncytiotrophoblast cells; VCT, villous cytotrophoblast cells; dM, decidual macrophages; dP, decidual perivascular cells; dS, decidual stromal cells. Raw expression values were normalized, log transformed and summarized by published cell clustering where available or reproduced clustering annotated using marker genes and cell type nomenclature from the respective studies. The size of the dots indicates the proportion of cells in the respective cell type having greater-than-zero expression of ACE2 (first column), TMPRSS2 (second column) or both (third column), while the color indicates the mean expression of ACE2 (first and third columns) or TMPRSS2 (second column). b, Schematic illustration depicts major anatomical regions in the human respiratory tree demonstrated in this study: nasal, lower airway and lung parenchyma (left). Expression of ACE2 is from airway epithelial cell datasets: Vieira Braga et al.26 (middle) and Deprez et al.27 (right). Datasets were retrieved from existing sources and cell clustering and nomenclature were retained based on the respective studies. For gene expression results in the dot plots, the dot size represents the proportion of cells within the respective cell type expressing the gene and the dot color represents the average gene expression level within the particular cell type. Fig. 2: Respiratory expression of viral receptor/entry-associated genes and implications for viral transmissibility and genes associated with ACE2 expression.
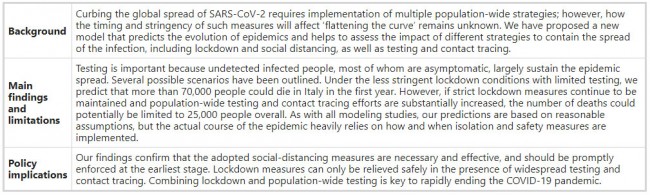
a, Expression of ACE2 (an entry receptor for SARS-CoV and SARS-CoV-2), ANPEP (an entry receptor for HCoV-229E), ST6GAL1/ST3GAL4 (enzymes important for synthesis of influenza entry receptors) and DPP4 (an entry receptor for MERS-CoV) from the airway epithelial datasets: Vieira Braga et al.26 (left) and Deprez et al.27 (right). The basic reproductive number (R0) for respective viruses, if available, is shown. b, Respiratory epithelial expression of the top 50 genes correlated with ACE2 expression based on Spearman’s correlation analysis (with Benjamini–Hochberg-adjusted P values) performed on all cells within the Vieira Braga et al.26 airway epithelial dataset. The colored gene names represent genes that are immune-associated (GO:0002376, immune system process or GO:0002526, acute inflammatory response). For gene expression results in the dot plots, the dot size represents the proportion of cells within the respective cell type expressing the gene and the color represents the average gene expression level within the particular cell type. Research | 22 April 2020 이탈리아 COVID-19 전염병 모델링 및 인구 전체 중재 실행 Modelling the COVID-19 epidemic and implementation of population-wide interventions in Italy https://www.nature.com/articles/s41591-020-0883-7 Table 1 Policy summary
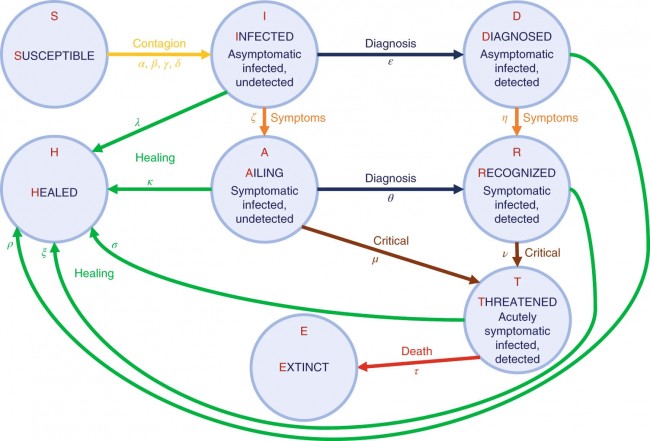
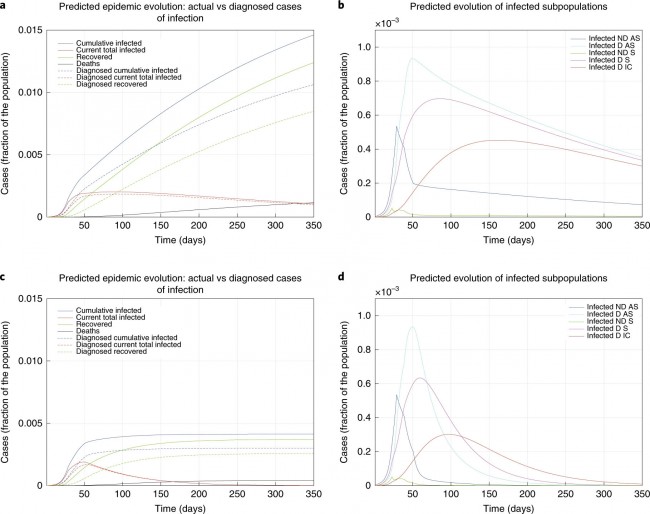
Fig. 1: The model.
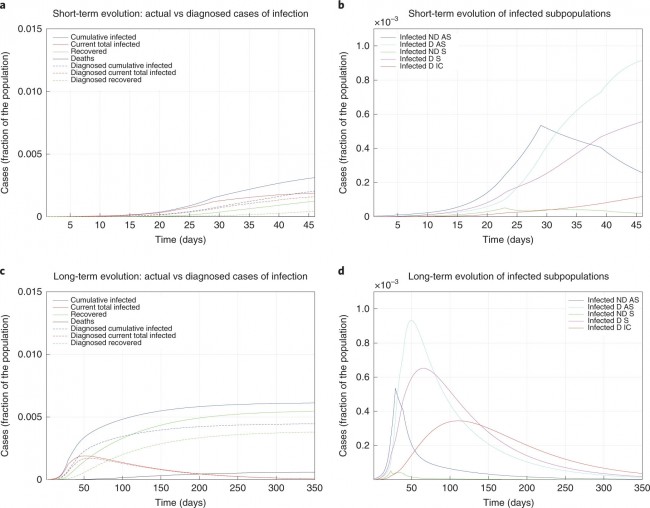
Graphical scheme representing the interactions among different stages of infection in the mathematical model SIDARTHE: S, susceptible (uninfected); I, infected (asymptomatic or pauci-symptomatic infected, undetected); D, diagnosed (asymptomatic infected, detected); A, ailing (symptomatic infected, undetected); R, recognized (symptomatic infected, detected); T, threatened (infected with life-threatening symptoms, detected); H, healed (recovered); E, extinct (dead). Fig. 2: Fitted and predicted epidemic evolution.
Epidemic evolution predicted by the model based on the available data about the COVID-19 outbreak in Italy. a,b, The short-term epidemic evolution obtained by reproducing the data trend with the model. c,d, The long-term predicted evolution over a 350-day horizon. a,c, The difference between the actual evolution of the epidemic (solid lines; this refers to all cases of infection, both diagnosed and non-diagnosed, predicted by the model, although non-diagnosed cases are of course not counted in the data) and the diagnosed epidemic evolution (dashed lines; this refers to all cases that have been diagnosed and are thus reported in the data). The plots in b and d distinguish between the different categories of infected patients: non-diagnosed asymptomatic (ND AS), diagnosed asymptomatic (D AS), non-diagnosed symptomatic (ND S), diagnosed symptomatic (D S) and diagnosed with life-threatening symptoms (D IC). Note that a,c and b,d have different scales. Fig. 3: The effect of lockdown.
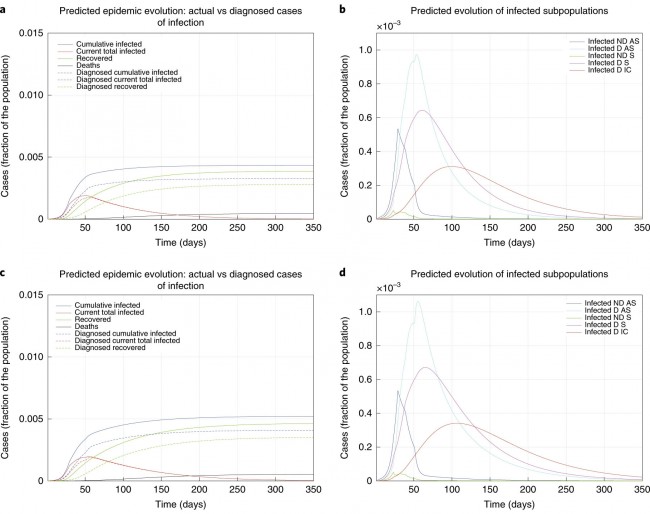
a–d, Epidemic evolution predicted by the model for the COVID-19 outbreak in Italy when, after day 50, the social distancing countermeasures are weakened, leading to a larger R0 = 0.98 (a,b), or strengthened, leading to a smaller R0 = 0.50 (c,d). a,c, The difference between the actual (real cases) and perceived (diagnosed cases) evolution of the epidemics. The plots in b and d distinguish between the different categories of infected patients: non-diagnosed asymptomatic (ND AS), diagnosed asymptomatic (D AS), non-diagnosed symptomatic (ND S), diagnosed symptomatic (D S) and diagnosed with life-threatening symptoms (D IC). Note that a,c and b,d have different scales. Fig. 4: The effect of testing.
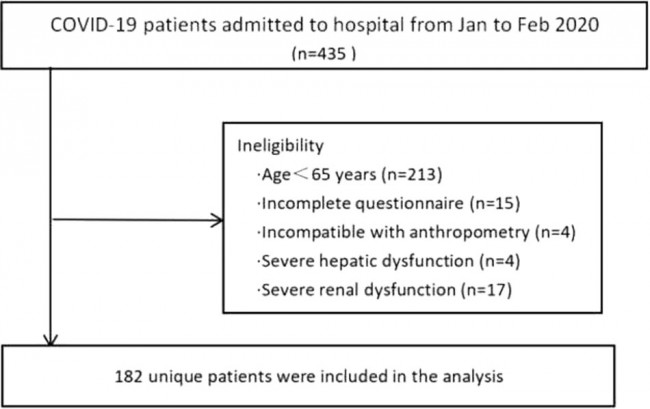
a–d, Epidemic evolution predicted by the model for the COVID-19 outbreak in Italy when, after day 50, massive testing and contact tracing is enforced (a,b), leading to R0 = 0.59, as well as in parallel with weakening social-distancing measures (c,d), leading to R0 = 0.77. The plots in a and c show the difference between the actual (real cases) and the perceived (diagnosed cases) evolution of the epidemics. The plots in b and d distinguish between the different categories of infected patients: non-diagnosed asymptomatic (ND AS), diagnosed asymptomatic (D AS), non-diagnosed symptomatic (ND S), diagnosed symptomatic (D S) and diagnosed with life-threatening symptoms (D IC). Note that a,c and b,d have different scales. Research | 22 April 2020 중국 우한시 COVID-19 노인 환자의 영양실조 유병률 및 관련 인자 분석 Prevalence of malnutrition and analysis of related factors in elderly patients with COVID-19 in Wuhan, China https://www.nature.com/articles/s41430-020-0642-3 Fig. 1 Flow of patients in the study.
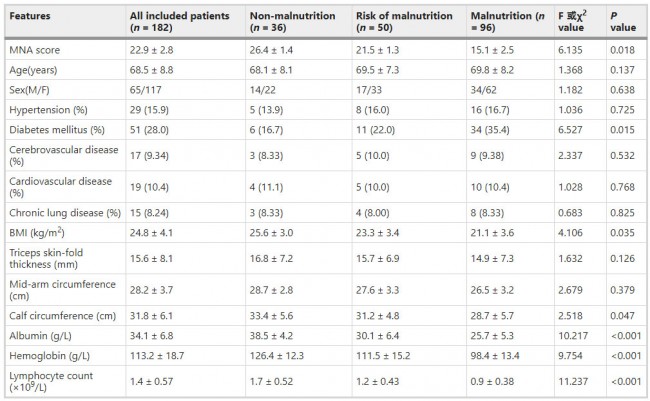
Table 1 Clinical features of the three groups.
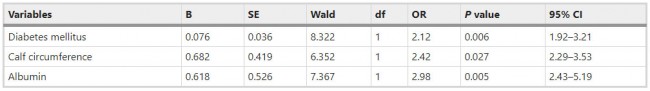
Table 2 Multiple logistic regression models for the variables associated with malnutrition.
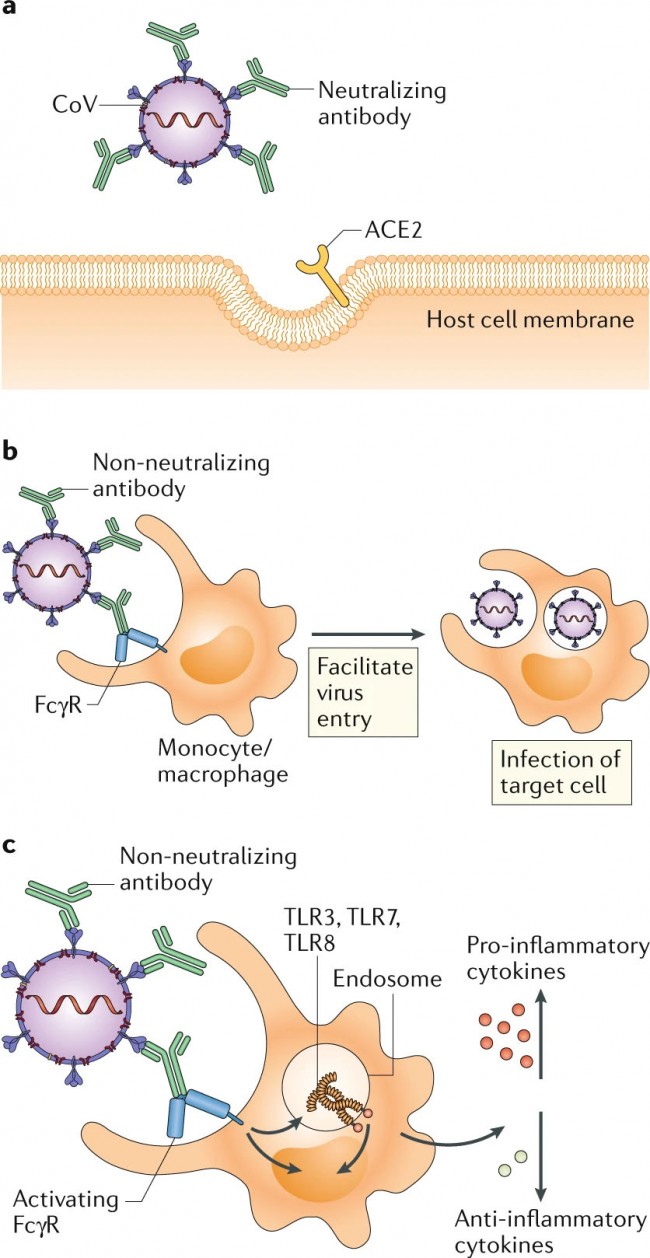
Comments and Opinion | 21 April 2020 COVID-19에서 차선의 항체 반응의 잠재적 위험 The potential danger of suboptimal antibody responses in COVID-19 https://www.nature.com/articles/s41577-020-0321-6 Fig. 1: Potential outcomes of antibody response to coronavirus.
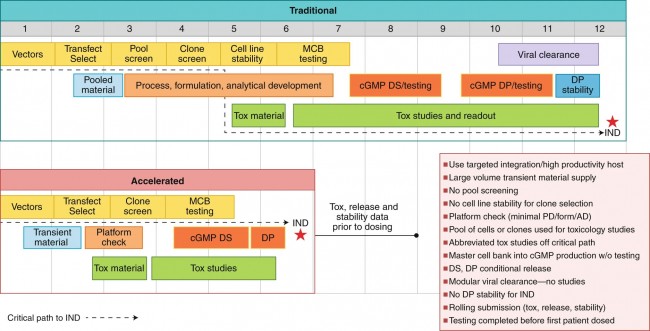
a | In antibody-mediated viral neutralization, neutralizing antibodies binding to the receptor-binding domain (RBD) of the viral spike protein, as well as other domains, prevent virus from docking onto its entry receptor, ACE2. b | In antibody-dependent enhancement of infection, low quality, low quantity, non-neutralizing antibodies bind to virus particles through the Fab domains. Fc receptors (FcRs) expressed on monocytes or macrophages bind to Fc domains of antibodies and facilitate viral entry and infection. c | In antibody-mediated immune enhancement, low quality, low quantity, non-neutralizing antibodies bind to virus particles. Upon engagement by the Fc domains on antibodies, activating FcRs with ITAMs initiate signalling to upregulate pro-inflammatory cytokines and downregulate anti-inflammatory cytokines. Immune complexes and viral RNA in the endosomes can signal through Toll-like receptor 3 (TLR3), TLR7 and/or TLR8 to activate host cells, resulting in immunopathology. Comments and Opinion | 21 April 2020 유행성 전염 속도로 치료용 모노클론 항체 개발 Developing therapeutic monoclonal antibodies at pandemic pace https://www.nature.com/articles/s41587-020-0512-5 Fig. 1: Accelerated phase 1 CMC mAb timeline for a pandemic.
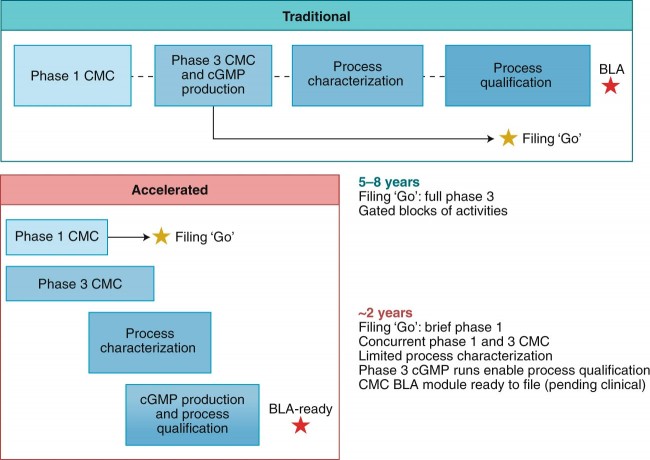
The timeline to phase 1 clinical studies using mAb therapeutics for pandemic outbreaks can be substantially accelerated without heightened product safety risks as compared with current practice. Tox, toxicology; MCB, master cell bank; DS, drug substance; DP, drug product; PD, process development; form, formulation; AD, analytical development. Fig. 2: mAb product development for pandemics (mAb lead identification to BLA).
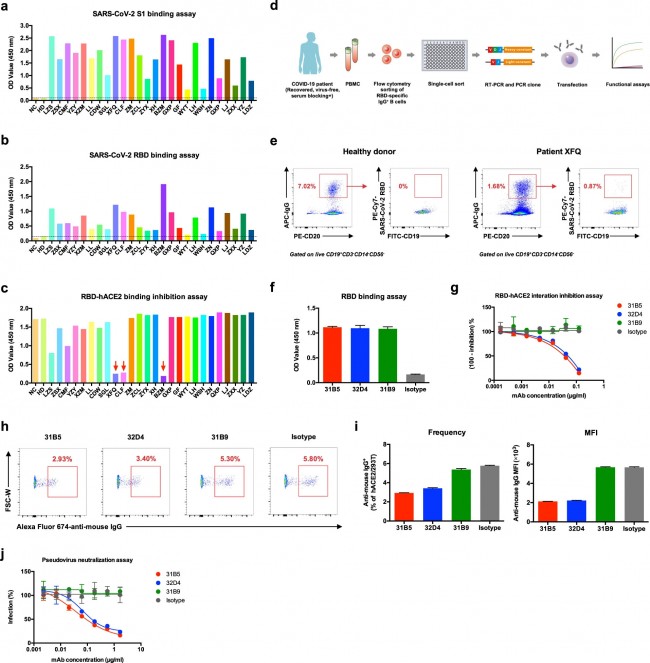
The fastest path to licensure for therapeutic mAbs treating pandemic outbreaks requires accepting business risks and preinvestment, but without major product quality, supply and regulatory risks. Correspondence | 20 April 2020 사람 모노클론 항체는 안지오텐신 전환효소 2 수용체에 대한 SARS-CoV-2 스파이크 단백질의 결합을 차단한다. Human monoclonal antibodies block the binding of SARS-CoV-2 spike protein to angiotensin converting enzyme 2 receptor https://www.nature.com/articles/s41423-020-0426-7 Fig. 1
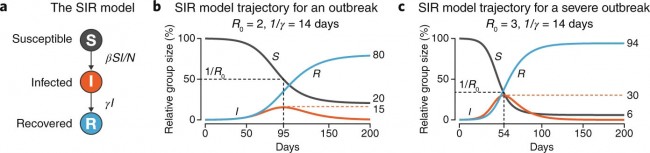
Human monoclonal antibodies block the SARS-CoV-2 RBD protein-hACE2 protein interaction a ELISA binding assay of COVID-19 patient sera to ELISA plate coating of SARS-CoV-2 S1 protein. b ELISA binding assay of COVID-19 patient sera to ELISA plate coating of SARS-CoV-2 RBD protein. c COVID-19 patient serum-mediated inhibition of the SARS-CoV-2 S1 protein binding to hACE2 protein by ELISA. d An overall strategy of anti-SARS-CoV-2 RBD mAbs. e Flow cytometry analysis of SARS-CoV-2 RBD-specific IgG+ B cells in PBMCs of healthy donor and patient XFQ. f Specificity of mAbs (311mab–31B5, −32D4 and −31B9 clones) to SARS-CoV-2 RBD protein by ELISA. g ELISA analysis of SARS-CoV-2 RBD-hACE2 interaction inhibited by 311mab–31B5, −32D4, and −31B9 mAbs. h Flow cytometry analysis of SARS-CoV-2 RBD-hACE2 interaction inhibited by 311mab–31B5, −32D4, and −31B9 mAbs. The numbers adjacent to the outlined areas indicate the percentages of anti-mouse IgG+ hACE2-plasmid transiently transfected 293T cells, which are summarized in i (left panel). i (right panel) Mean fluorescence intensity (MFI) of Alexa Fluor 647 anti-mouse IgG in anti-mouse IgG+ hACE2-plasmid transiently transfected 293T cells. j Antibody-mediated blocking of luciferase-encoding SARS-Cov-2 typed pseudovirus into hACE2/293T cells. NC, negative control. HD, healthy donor. The data are representative of two independent experiments with three replicates per group (f, g, i, j; error bars in f, g, i, j indicate the SD) News | 20 April 2020 감염성 전염병 모델링 Modeling infectious epidemics https://www.nature.com/articles/s41592-020-0822-z Fig. 1: A simple SIR model of infection spread in a population.
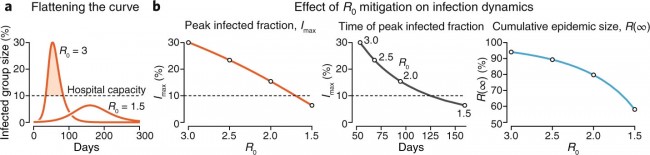
a, Three population groups in the model. b, The trajectory of S (black), I (orange) and R (blue) for an outbreak with R0 = 2 and 1/γ = 14 days (β = R0γ = 0.14/day). Values at end of traces show cumulative epidemic size (R(∞) = 80%), fraction escaping infection (S(∞) = 20%) and peak infection rate (Imax = 15%, dashed orange line), which occurs at S = 1/R0 = 0.5 and t = 95 days (black dashed line). Initial SIR conditions were S(0) = 0.999 and I(0) = 0.001, R(0) = 0, implying a population size of 1,000. Trajectories are computed numerically for 100 time steps. c, Same as b but for a more serious outbreak with R0 = 3 (β = 0.21/day). Fig. 2: The effect of R0 mitigation on infection spread.
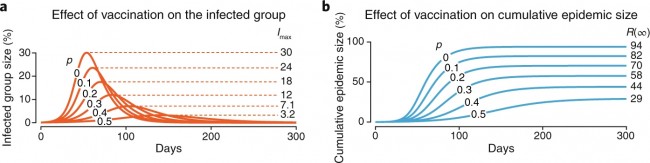
a, When R0 is reduced, the infected group trajectory is flattened and delayed. b, Trends in peak infected fraction Imax (orange), relationship between Imax and the time at which it occurs (black) and cumulative epidemic size R(∞) (blue) as R0 decreases from 3.0 to 1.5. Dashed horizontal line indicates a putative hospital capacity target for mitigation efforts. Infectious period is 1/γ = 14 days for all plots, but β varies from 0.21 to 0.11. Fig. 3: The effect of vaccination on trajectory of a disease with R0 = 3 at vaccination fractions p = 0 to 0.5.
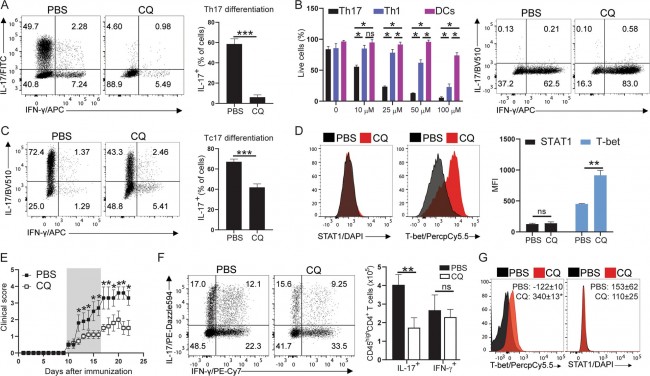
a, Trajectories of the infected fraction for each p. Dashed lines indicate peak infection, Imax. b, Trajectories of the recovered fraction. Values at end of profiles indicate total epidemic size, R(∞). Correspondence | 20 April 2020 클로로퀸은 T 세포에서 T-bet 발현을 자극하여 Th17 세포 분화를 감소시킨다. Chloroquine reduces Th17 cell differentiation by stimulating T-bet expression in T cells https://www.nature.com/articles/s41423-020-0432-9 Fig. 1
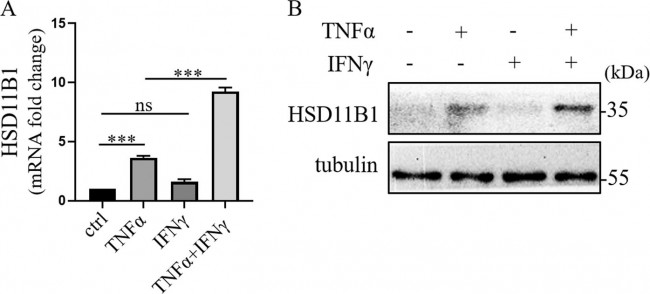
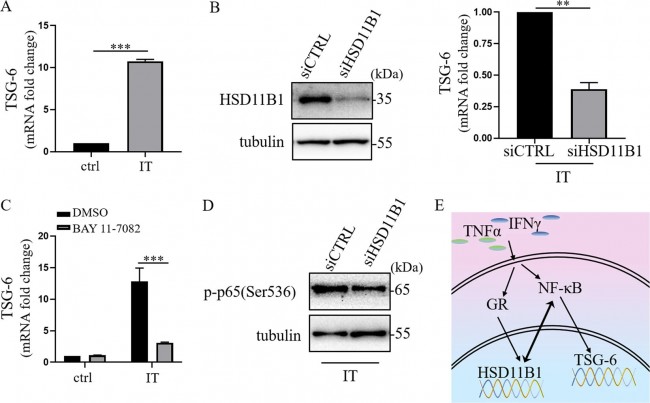
CQ inhibits Th17 cell differentiation by stimulating T-bet expression. a CD4+ T cells from WT mice were isolated using magnetic beads according to the manufacturer’s instructions (Miltenyi Biotec.). CD4+ T cells (200,000) were plated on 96-well U-bottom plates with anti-CD3/CD28 (1 µg/mL each) under Th17 polarizing conditions (recombinant mouse TGF-β1: 2.5 ng/mL; recombinant mouse IL-6: 20 ng/mL; anti-IFN-γ: 10 µg/mL and anti-IL-4: 5 µg/mL) in the presence or absence of increasing concentrations of CQ (10, 25, 50, and 100 µM) for 72 h. At the end of the culture period, the cells were collected and stimulated with phorbol 12-myristate 13-acetate (PMA, 50 ng/mL, Sigma-Aldrich), ionomycin (500 ng/mL, Sigma-Aldrich) and GolgiPlug (1 µg/mL, BD Biosciences) for 3 h at 37 °C. The cells were then surface stained with fluorescent antibodies against CD45 and CD4 for 20 min at 4 °C, fixed and permeabilized with commercial kits (Perm buffer, Thermo Fisher) and stained overnight with antibodies against IL-17, IFN-γ, GM-CSF, RORγt, T-bet, and STAT1. b Th17 cells were prepared as described in (a). Th1 cells were prepared by stimulating CD4+ T cells with anti-CD3/CD28 (1 µg/mL each) and recombinant mouse IL-12 (25 ng/mL) for 72 h, and DCs were generated from bone marrow precursors in the presence of recombinant mouse GM-CSF (10 ng/mL) for 7 days. The cells were treated with increasing doses of CQ as described in (a), after which cell viability was measured by propidium iodide incorporation analysis by flow cytometry and trypan blue staining analysis by hemocytometer. c Tc17 cells were generated as described in (a) with CD8+ T cells that were magnetically isolated from WT mice. d Flow cytometry analysis of T-bet and STAT1 from samples described in (a). e WT mice were s.c. immunized with 200 µg of MOG35–55 peptide (GenScript) emulsified in complete Freund’s adjuvant containing 5 mg/mL M. tuberculosis H37RA and 240 ng of pertussis toxin at days 0 and 2 p.i. Half of the mice (n = 5/group) were treated with CQ (3.5 mg/kg), while the remaining mice received PBS daily via i.p. administration for seven consecutive days (shaded area in the plot). Disease development was monitored daily. f EAE mice were euthanized at day 21 p.i. and their CNS cells were collected and processed for flow cytometry analysis. Cells that infiltrated the CNS were activated with PMA, ionomycin and GolgiPlug and stained for flow cytometry as indicated in (a). g Flow cytometry analysis of T-bet and STAT1 expression in Th17 cells from (f). The results are expressed as a representative flow cytometry graph and/or cumulative graphs depicting the mean ± SEM of each group. Analyses between two groups were performed with Student’s t tests, while analyses between three or more groups were performed with one-way ANOVA followed by Bonferroni post tests. For analysis of clinical scores, we employed two-way ANOVA with Sidak post tests. In all analyses, p values < 0.05, < 0.01, and < 0.001 were considered statistically significant (denoted with *, **, and ***, respectively; Ns not significant). All experiments were repeated at least three times with three replicates in each culture experiment. All experiments with animals were approved by the institutional animal welfare committee Research | 20 April 2020 HSD11B1은 IFNγ과 TNFα에 의해 시너지 효과를 가지며 상향 조절되고 사람 UC-MSC에서 TSG-6 발현을 매개한다. HSD11B1 is upregulated synergistically by IFNγ and TNFα and mediates TSG-6 expression in human UC-MSCs https://www.nature.com/articles/s41420-020-0262-7 Fig. 1: The expression of HSD11B1 was significantly increased in IFNγ and TNFα licensed human UC-MSCs.
a Real-time PCR was employed to measure HSD11B1 in human UC-MSCs after TNFα and IFNγ stimulation. The histograms represent the mean values ± SEM from three independent experiments (n = 9). Asterisks indicate highly significant (***p < 0.001) differences (Student’ t test). Data are presented as fold change relative to ctrl human UC-MSCs. b Western blotting was performed to detect HSD11B1 in human UC-MSCs after TNFα and IFNγ stimulation. Fig. 2: IFNγ and TNFα synergistically enhanced the expression of HSD11B1 in human UC-MSCs via NF-κB p65.
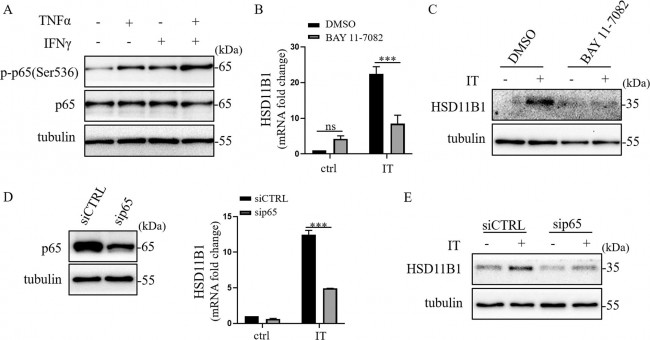
a Western blotting was performed to detect p-p65 (Ser536) in human UC-MSCs after TNFα and IFNγ stimulation. b Real-time PCR was employed to measure HSD11B1 in human UC-MSCs when NF-κB was inhibited by BAY 11-7082 in IT (TNFα combined with IFNγ) stimulation. The histograms represent the mean values ± SEM from three independent experiments (n = 9). Asterisks indicate highly significant (***p < 0.001) differences (ANOVA). Data are presented as fold change relative to DMSO-ctrl human UC-MSCs. c Western blotting was performed to detect HSD11B1 in human UC-MSCs when NF-κB was inhibited by BAY 11-7082 in IT stimulation. d Knockdown efficiency of sip65 was examined by Western blotting. Real-time PCR was employed to measure HSD11B1 in p65-depleted human UC-MSCs after IT stimulation. The histograms represent the mean values ± SEM from three independent experiments (n = 9). Asterisks indicate highly significant (***p < 0.001) differences (ANOVA). Data are presented as fold change relative to siCTRL-ctrl human UC-MSCs. e Western blotting was performed to detect HSD11B1 in p65-depleted human UC-MSCs after IT stimulation. Fig. 3: Glucocorticoid receptor (GR) was involved in IFNγ and TNFα-induced HSD11B1 expression.
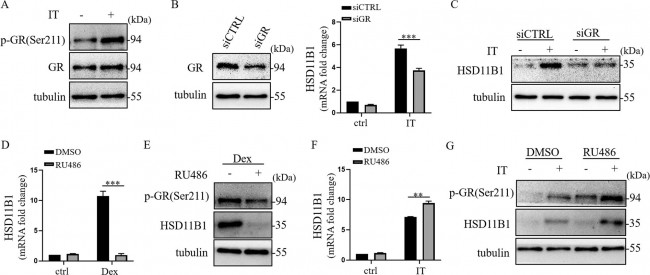
a Western blot analysis was performed to detect p-GR(Ser211) in human UC-MSCs under IT (TNFα combined with IFNγ) stimulation. b Knockdown efficiency of GR was examined by Western blotting. Real-time PCR was employed to measure HSD11B1 in GR-depleted human UC-MSCs after IT stimulation. The histograms represent the mean values ± SEM from three independent experiments (n = 9). Asterisks indicate highly significant (***p < 0.001) differences (ANOVA). Data are presented as fold change relative to siCTRL-ctrl human UC-MSCs. c HSD11B1 was detected in GR-depleted human UC-MSCs after IT stimulation by Western blotting. d Real-time PCR was performed to detect HSD11B1 in human UC-MSCs under stimulation of dexamethasone or RU486 alone or a combination of them. The histograms represent the mean values ± SEM from three independent experiments (n = 9). Asterisks indicate highly significant (***p < 0.001) differences (ANOVA). Data are presented as fold change relative to DMSO-ctrl human UC-MSCs. e Western blotting was employed to detect HSD11B1 and p-GR(Ser211) in human UC-MSCs under stimulation of dexamethasone or RU486 alone or a combination of them. f Real-time PCR was employed to measure HSD11B1 in human UC-MSCs under stimulation of RU486 alone or a combination of IT. The histograms represent the mean values ± SEM from three independent experiments (n = 9). Asterisks indicate highly significant (**p < 0.01) differences (ANOVA). Data are presented as fold change relative to DMSO-ctrl human UC-MSCs. g Western blotting was employed to detect HSD11B1 and p-GR(Ser211) in human UC-MSCs under stimulation of RU486 alone or a combination of IT. Fig. 4: HSD11B1 mediated the expression of TSG-6 induced by IFNγ and TNFα via NF-κB.
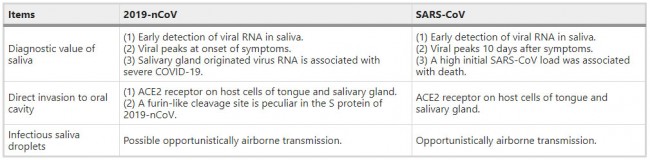
a TSG-6 in human UC-MSCs under IT (TNFα combined with IFNγ) stimulation was detected by real-time PCR. The histograms represent the mean values ± SEM from three independent experiments (n = 9). Asterisks indicate highly significant (***p < 0.001) differences (Student’ t test). Data are presented as fold change relative to ctrl human UC-MSCs. b Knockdown efficiency of siHSD11B1 was examined by Western blotting. TSG-6 in HSD11B1-depleted human UC-MSCs after IT stimulation was measured by real-time PCR. The histograms represent the mean values ± SEM from three independent experiments (n = 9). Asterisks indicate highly significant (**p < 0.01) differences (Student’ t test). Data are presented as fold change relative to siCTRL human UC-MSCs. c TSG-6 in human UC-MSCs under BAY 11-7082 and IT stimulation was analyzed by real-time PCR. The histograms represent the mean values ± SEM from three independent experiments (n = 9). Asterisks indicate highly significant (***p < 0.001) differences (ANOVA). Data are presented as fold change relative to DMSO-ctrl human UC-MSCs. d p-p65(Ser536) in HSD11B1-depleted human UC-MSCs under IT stimulation was detected by Western blotting. e The schematic overview of IFNγ and TNFα regulated HSD11B1 production and HSD11B1 regulated TSG-6 production in human UC-MSCs. Editorial | 17 April 2020 COVID-19와의 경쟁 The race against COVID-19 https://www.nature.com/articles/s41565-020-0680-y Reviews | 17 April 2020 타액 : 2019-nCoV의 잠재적 진단값 및 전염 Saliva: potential diagnostic value and transmission of 2019-nCoV https://www.nature.com/articles/s41368-020-0080-z Table 1 Comparison of 2019-nCoV and SARS-CoV in terms of saliva
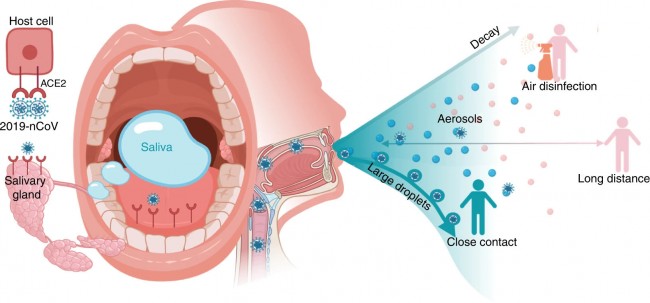
Fig. 1
Potential diagnostic value of saliva and transmission of 2019-nCoV. Possibly combing to host-cell receptor of ACE2 expressed in salivary glands and tongue, 2019-nCoV is detected in saliva. Combined with infectious fluids from respiratory system, 2019-nCoV via large saliva droplets sets up short-distance transmission and hardly form long-distance aerosol transmission outdoors due to complicated physical and biological decay. Prevention of droplets formation, implementation of air disinfection, and blockage of droplets acquisition could possibly slow down 2019-nCoV dissemination Research Highlights | 17 April 2020 우리는 COVID-19에서 보호 또는 재감염을 볼 수 있나? Will we see protection or reinfection in COVID-19? https://www.nature.com/articles/s41577-020-0316-3 Research Highlights | 17 April 2020 대식세포: COVID-19의 트로이 목마? Macrophages: a Trojan horse in COVID-19? https://www.nature.com/articles/s41577-020-0317-2 News | 17 April 2020 항체 검사에 따르면 코로나바이러스 감염이 공식 수치를 크게 초과했다. 연구에 따르면 공식 사례에 비해 코로나바이러스 감염이 50배 이상 증가한 것으로 추정되지만 전문가들은 항체 키트의 신뢰성에 대한 우려를 제기했습니다. Antibody tests suggest that coronavirus infections vastly exceed official counts Study estimates a more than 50-fold increase in coronavirus infections compared to official cases, but experts have raised concerns about the reliability of antibody kits. https://www.nature.com/articles/d41586-020-01095-0 Research Highlights | 17 April 2020 SARS-CoV-2와 숙주 세포 상호작용 지도 A map of SARS-CoV-2 and host cell interactions |